Programming Note: I will be at the MTA Symposium on Thursday and Friday, and Art's Charts will not be published on those days.
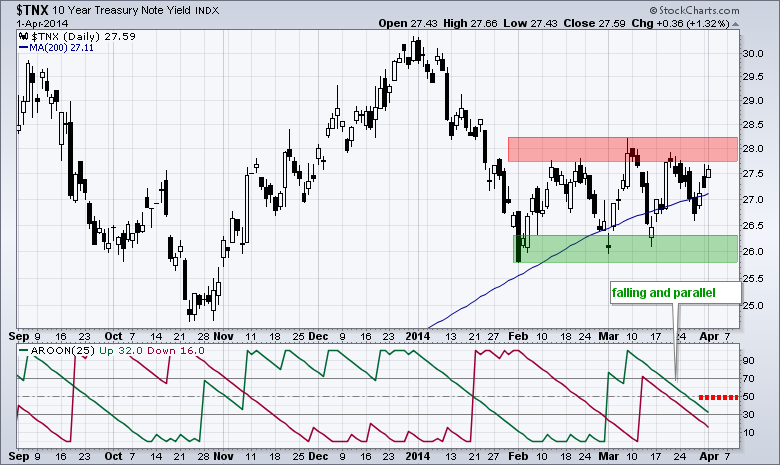
The first trading day of the month lived up to its bullish reputation as stocks surged with a fairly broad-based rally. The Nasdaq 100 ETF (QQQ) led the advance with a 1.72% gain. Seven of the nine sector SPDRs were up with the Consumer Discretionary SPDR (XLY) and Technology SPDR (XLK) leading the charge. The Consumer Staples SPDR (XLP) and Utilities SPDR (XLU) lagged as money moved into riskier sectors. Cisco (CSCO) led the Networking iShares (IGN) to a big gain (2%), Nvidia (NVDA) and Marvell (MRVL) led the Semiconductor SPDR (XSD) to a 1.87% gain on the day. Signs of rotation were also evident in the Treasury bond market as the 20+ YR T-Bond ETF (TLT) fell sharply and negated last week's breakout. The chart below shows the 10-YR Treasury Yield ($TNX) bouncing back above 27.5 (2.75%) over the last three days. The yield remains range bound as we head into this week's employment report countdown. A break above the red resistance zone would project higher yields and this would be bearish for TLT and the 7-10 YR T-Bond ETF (IEF). The indicator window shows Aroon Up and Aroon Down falling in parallel fashion, which is how these indicators work during a consolidation. The first one to break above 50 will trigger the next signal for the Aroon brothers.
**This chart analysis is for educational purposes only, and should not
be construed as a recommendation to buy, sell or sell-short said securities**
**************************************************************
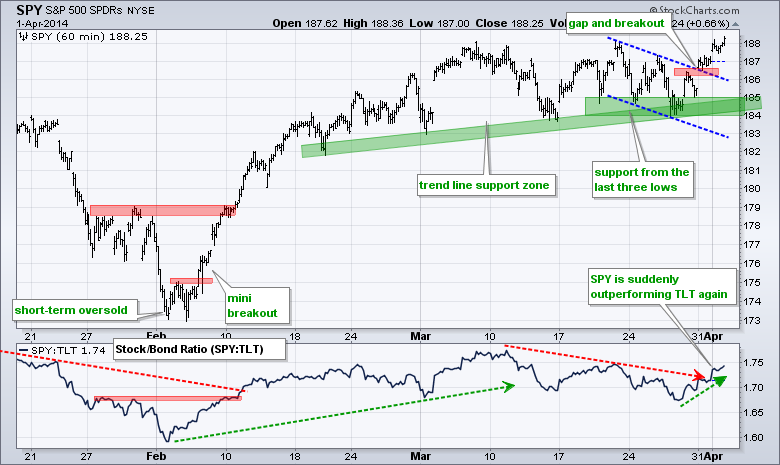
SPY broke channel resistance with a gap on Monday and continued higher on Tuesday. The breakout is holding and broken resistance turns first support in the 186 area. The late March lows and trend line zone mark support in the 184-185 area. The indicator window shows SPY starting to outperform TLT as the price relative moved higher the last few days.
**************************************************************
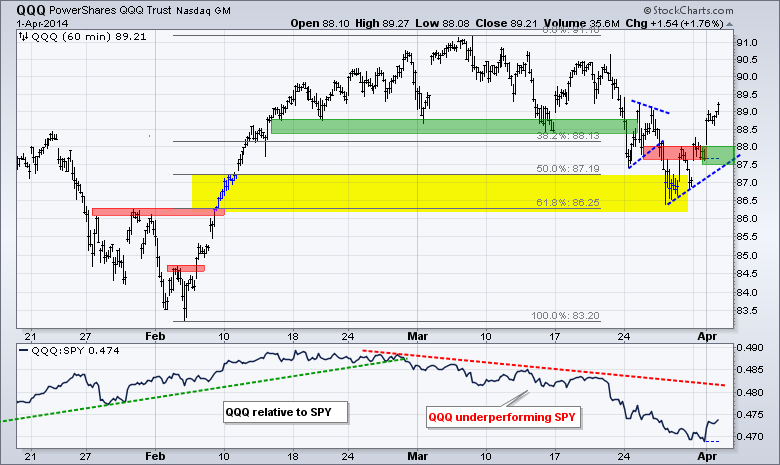
QQQ surged to 88 on Monday and above 89 on Tuesday. Looks like this big tech ETF is making up for lost ground. Broken resistance and the late March trend line mark support in the 87.5-88 area.
**************************************************************
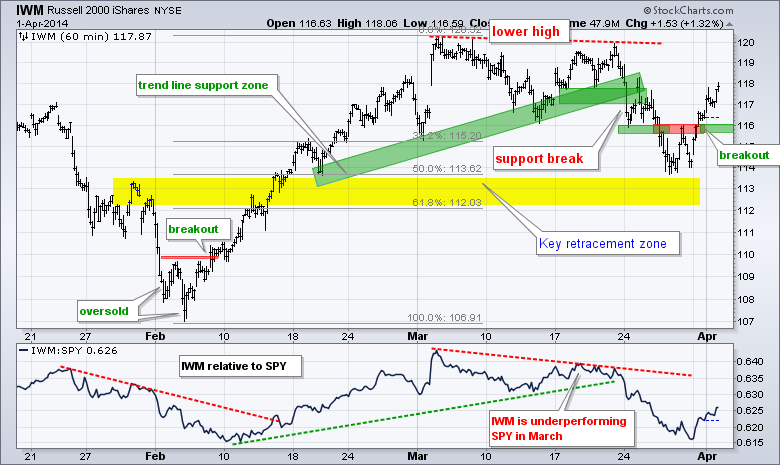
IWM found support near the 50% retracement and just above the broken resistance zone. The ETF formed two lows near 114 and broke above 116 on Monday. This breakout extended further on Tuesday with a move to 118 and broken resistance turns fist support in the 116 area.
**************************************************************
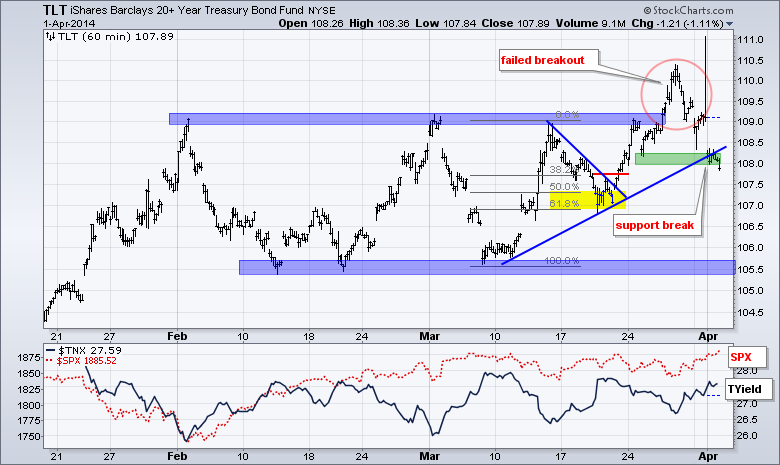
The 20+ YR T-Bond ETF (TLT) broke resistance, fell back below the breakout and broke first support on Tuesday. The breakout has failed and the short-term trend is down. This bearish development for Treasuries is a positive for the stock market
**************************************************************
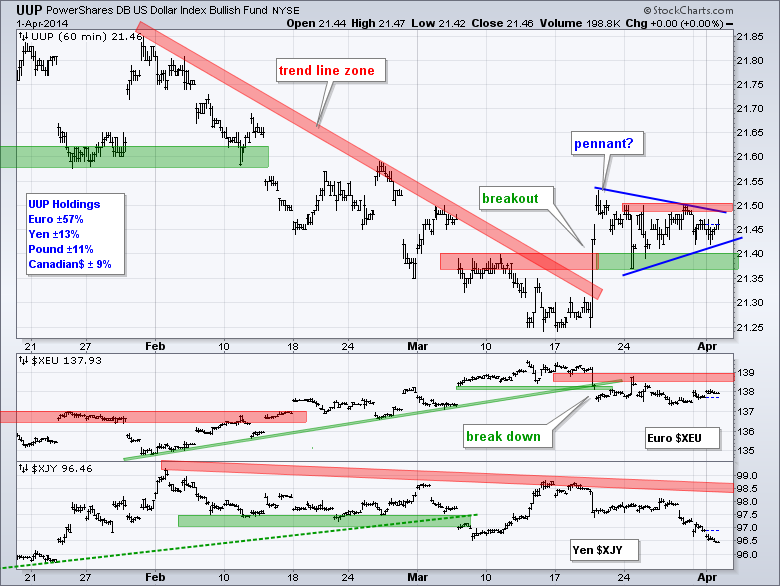
The US Dollar ETF (UUP) is making a breakout bid as the Euro remains soft ahead of this week's European Central Bank (ECB) meeting. Overall, UUP is holding the breakout at 21.40 and this area turned into support. I will stay with a bullish bias as long as 21.35 holds in UUP and the Euro remains below 139.
**************************************************************
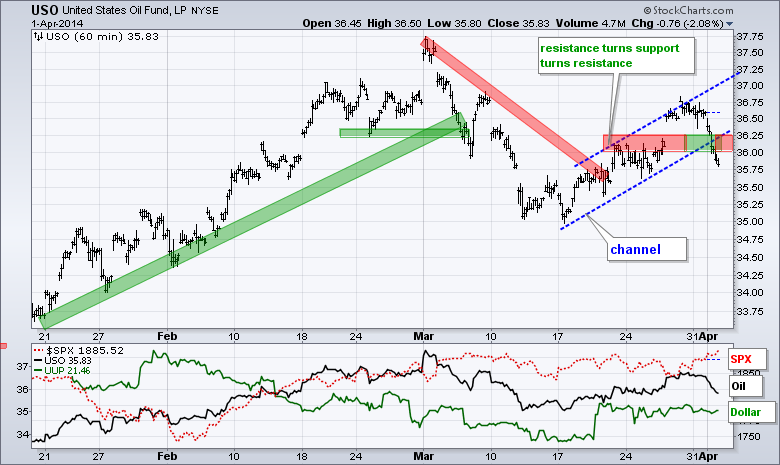
The USO Oil Fund (USO) stalled in the 36.5 area and then broke channel support with a sharp decline on Tuesday. One would expect out to be strong with the stock market strong. This channel break reverses the short-term uptrend and I will mark first resistance near broken support.
**************************************************************
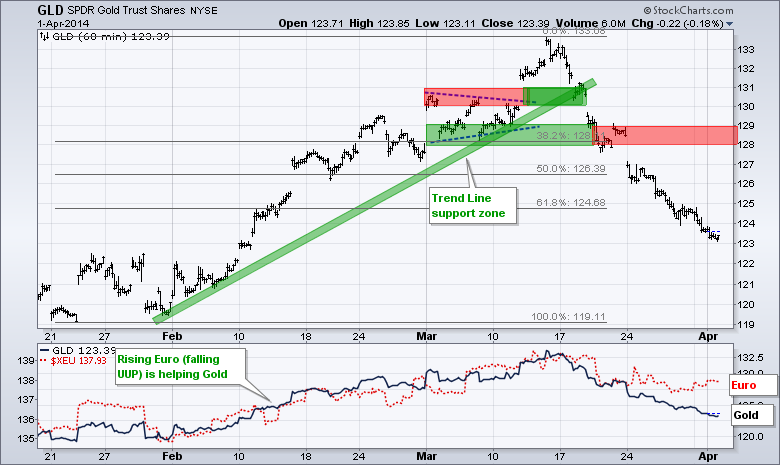
GLD is down over 7% from its high and still shows no signs of firming. Even though gold is oversold and ripe for a bounce, further weakening in the Euro could keep downward pressure on the yellow metal. Broken support in the 128-129 area turns into first resistance.
***************************************************************
Key Reports and Events (all times Eastern):
Wed - Apr 02 - 07:00 - MBA Mortgage Index
Wed - Apr 02 - 08:15 - ADP Employment Report
Wed - Apr 02 - 10:00 - Factory Orders
Wed - Apr 02 - 10:30 - Crude Oil Inventories
Thu - Apr 03 - 07:30 - Challenger Job Report
Thu - Apr 03 - 08:30 - Initial Jobless Claims
Thu - Apr 03 - 10:00 - ISM Services Index
Thu - Apr 03 - 10:30 - Natural Gas Inventories
Fri - Apr 04 - 08:30 - Employment Report
This commentary and charts-of-interest are designed to stimulate thinking. This analysis is
not a recommendation to buy, sell, hold or sell short any security (stock ETF or otherwise).
We all need to think for ourselves when it comes to trading our own accounts. First, it is
the only way to really learn. Second, we are the only ones responsible for our decisions.
Think of these charts as food for further analysis. Before making a trade, it is important
to have a plan. Plan the trade and trade the plan. Among other things, this includes setting
a trigger level, a target area and a stop-loss level. It is also important to plan for three
possible price movements: advance, decline or sideways. Have a plan for all three scenarios
BEFORE making the trade. Consider possible holding times. And finally, look at overall market

