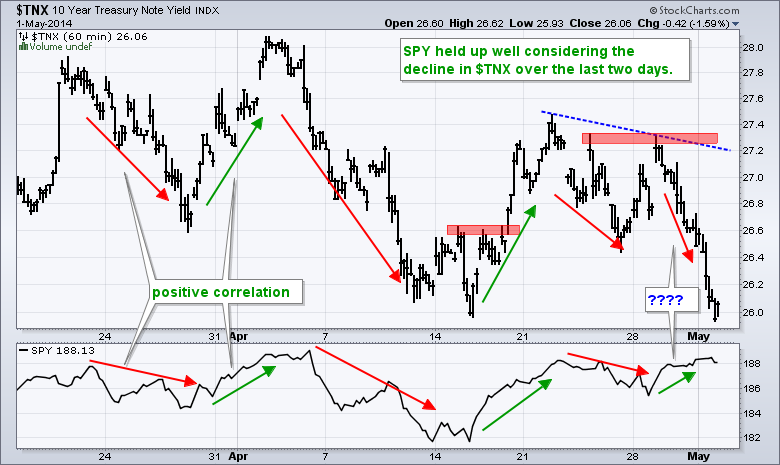
There is no change on the charts as the current patterns held up. SPY and QQQ have flag breakouts, while IWM is bouncing within a downtrend. IWM could be forming a bear flag/wedge over the last few days. Treasuries surged this week as the 10-YR Treasury Yield ($TNX) fell to its mid April lows. The decline in the 10-YR Treasury Yield was actually quite drastic and suggests that bond traders were getting into Treasuries ahead of the employment report. Does the bond market know something here? Treasuries rally and yields fall when economic conditions deteriorate and/or inflationary expectations decline. A better-than-expected employment report might catch the bond market by surprise, and hence the stock market. The 10-YR Treasury Yield and S&P 500 SPDR were positively correlated from mid March to late April. This correlation turned negative over the last four days as the 10-YR Treasury Yield fell sharply and SPY edged higher. Something may need to give.
**This chart analysis is for educational purposes only, and should not
be construed as a recommendation to buy, sell or sell-short said securities**
*************************************************************
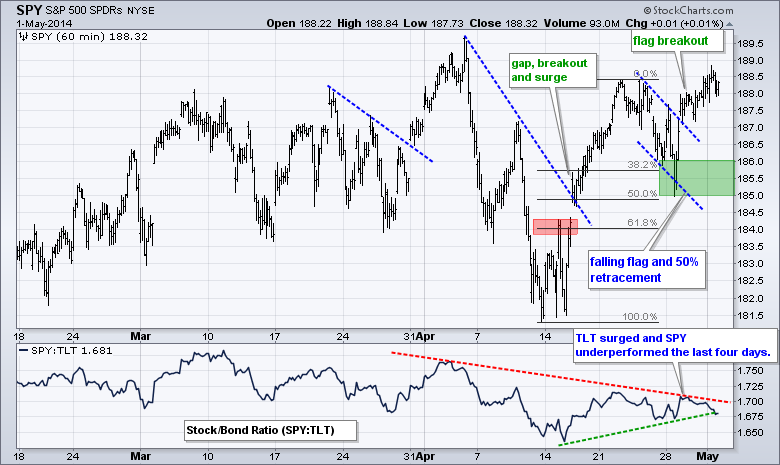
No change. SPY continues to trade better than IWM and QQQ. SPY surged above 188 in late April and then corrected with a falling flag that retraced 50%. The ETF broke flag resistance with a surge on Tuesday and then consolidated above this breakout. I will set short-term support at 185. SPY was starting to outperform TLT, but the price relative turned down the last four days. Friday will be the moment-of-truth for this relationship.
**************************************************************
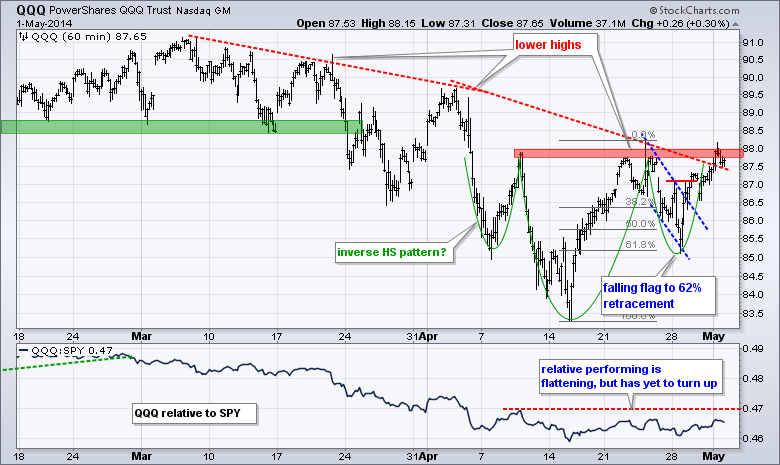
No change. QQQ remains in a downtrend overall, but the ETF managed to reverse off the 62% retracement and break the flag trend line with a surge above 87. Resistance at 88 remains in place and follow thru above this level would completely reverse the two month downtrend.
**************************************************************
No change. IWM remains in a downtrend and relatively weak. The ETF peaked in early March and fell throughout April. This decline could be a correction within a bigger uptrend, but IWM needs to break the sequence of lower lows and lower highs to fully reverse this downtrend. Look for a break above 114 to provide the first sign of a trend reversal.

**************************************************************
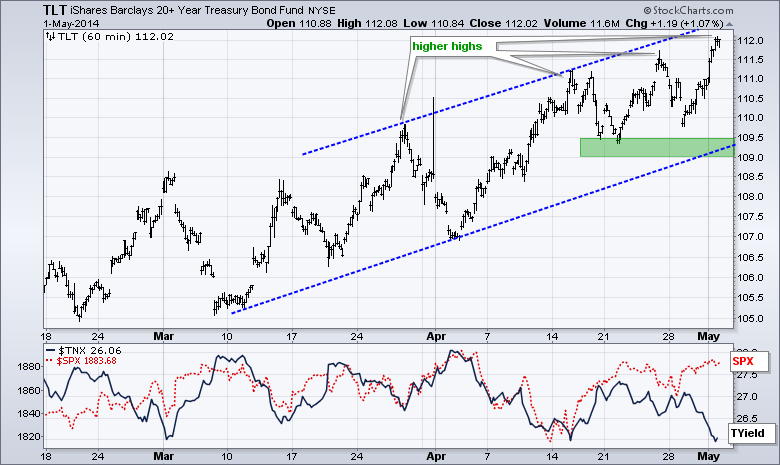
No change. The 20+ YR T-Bond ETF (TLT) surged to a new reaction high with the intraday move to 112 on Friday. This move extends the uptrend in Treasuries as we head into the employment report on Friday. The bond market is pricing in bad economic news this week so anything positive would likely weigh on Treasuries. On the price chart, last week's lows and the lower trend line of the rising channel mark uptrend support at 109.
**************************************************************
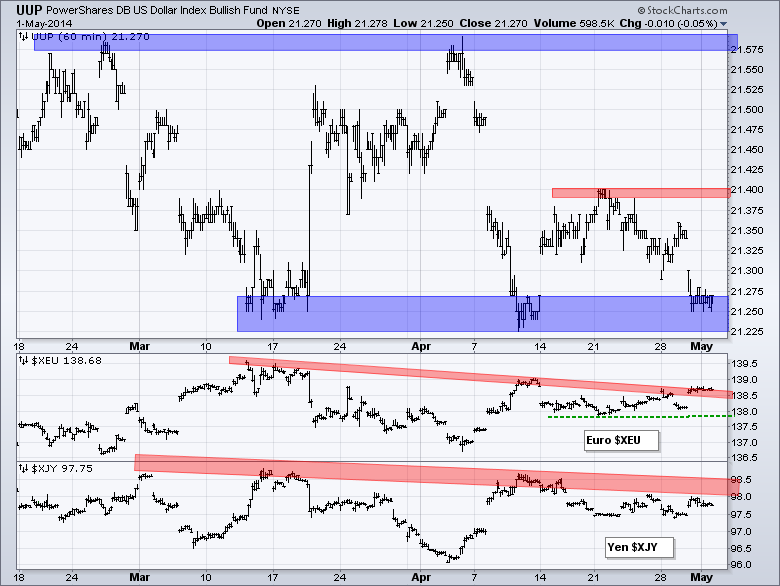
No change. The Dollar moved to the bottom of its range as Eurozone inflation ticked up in April (from .5% to .7%). UUP is now trading near the support zone and on the verge of a break that would signal a continuation of the bigger downtrend. A surge off support and break above 21.4 would call for a reassessment. The Euro Index ($XEU) is on the verge of a breakout and chartists can now mark support with the mid April lows.
**************************************************************
No change. The USO Oil Fund (USO) fell sharply and has now retraced 62% of the advance from mid March to mid April. The bigger trend for oil is up and this is still considered a correction within that uptrend. The falling channel defines this correction and I will mark resistance at 37. A break above this level would end the correction and signal a resumption of the bigger uptrend.

**************************************************************
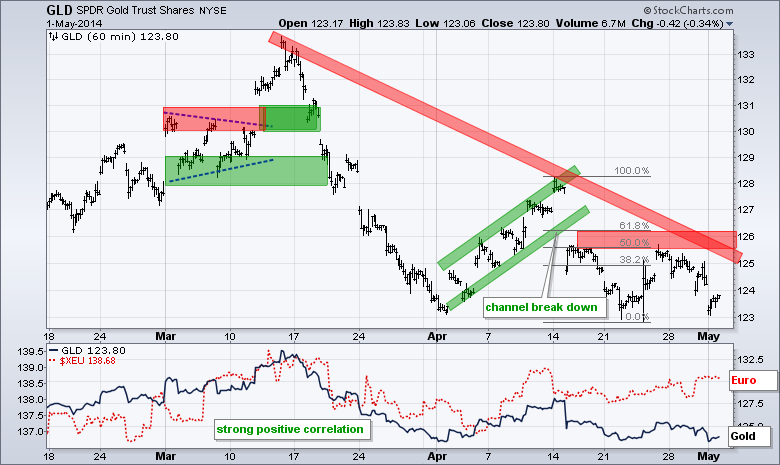
No change. This could be a big week for bullion. The Gold SPDR (GLD) remains in a downtrend, but I am lowering short-term resistance to the 126.2 level. The mid March trend line and recent highs mark resistance here. A breakout would provide the first clue that gold wants to move higher. Watch the 10-YR Treasury Yield ($TNX) for clues as well. A rise in yields would be negative for gold, while a decline would be positive.
***************************************************************
Key Reports and Events (all times Eastern):
Fri - May 02 - 08:30 - Employment Report
Fri - May 02 - 10:00 - Factory Orders
This commentary and charts-of-interest are designed to stimulate thinking. This analysis is not a recommendation to buy, sell, hold or sell short any security (stock ETF or otherwise). We all need to think for ourselves when it comes to trading our own accounts. First, it is the only way to really learn. Second, we are the only ones responsible for our decisions. Think of these charts as food for further analysis. Before making a trade, it is important to have a plan. Plan the trade and trade the plan. Among other things, this includes setting a trigger level, a target area and a stop-loss level. It is also important to plan for three possible price movements: advance, decline or sideways. Have a plan for all three scenarios BEFORE making the trade. Consider possible holding times. And finally, look at overall market conditions and sector/industry performance.


