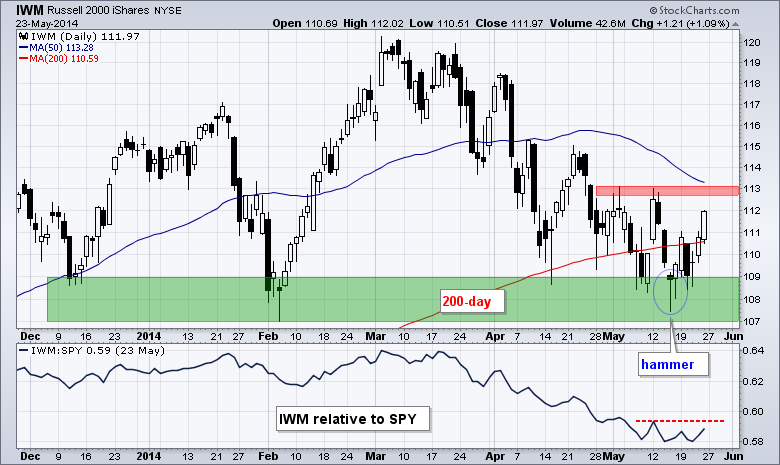
Last week was a pretty good week for stocks. First, small-caps led the market as the Russell 2000 ETF gained over 2%. Second, the Consumer Discretionary SPDR led the sectors higher with a 2.09% gain. Third, Treasuries actually fell as the 20+ YR T-Bond ETF lost .74% last week. Fourth, we also saw relative strength in the Home Construction iShares and Semiconductor SPDR, two cyclical groups that affect the consumer discretionary and technology sectors. Overall, SPY and QQQ remain in short-term uptrends and continue to work their way higher. IWM broke a trend line last week, but has yet to fully reverse the short-term downtrend, which evolved into a medium-term downtrend because IWM has been falling for just over two months. Even though IWM makes up less than 8% of the total stock market, it is positive to see these high-beta names rebounding. On the chart below, notice that IWM formed a hammer in mid May and then moved back above its rising 200-day moving average last week.
**This chart analysis is for educational purposes only, and should not
be construed as a recommendation to buy, sell or sell-short said securities**
**************************************************************
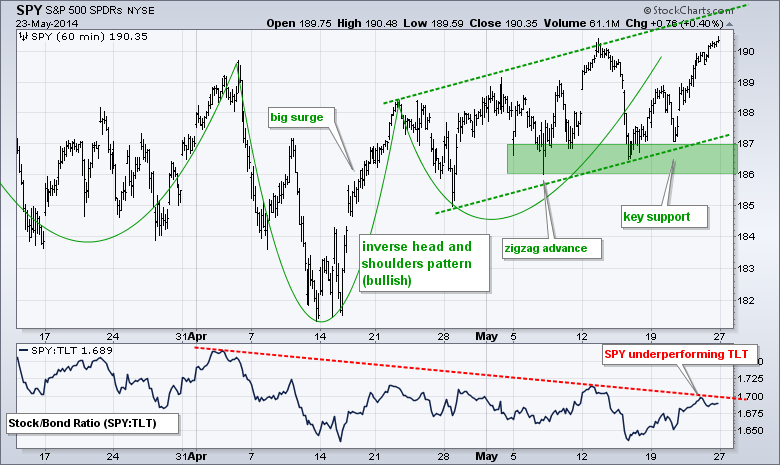
SPY remains in a clear and present uptrend. After surging from 182 to 188 in mid April, the ETF embarked on a zigzag advance with a series of higher highs and higher lows. The most recent higher high occurred on Friday. The May lows combine to mark a support zone in the 186-187 area. SPY is still underperforming TLT, but the price relative (SPY:TLT ratio) is near the trend line extending down from early April. A break above this trend line and the mid May high would signal relative strength in stocks (versus Treasuries).
**************************************************************
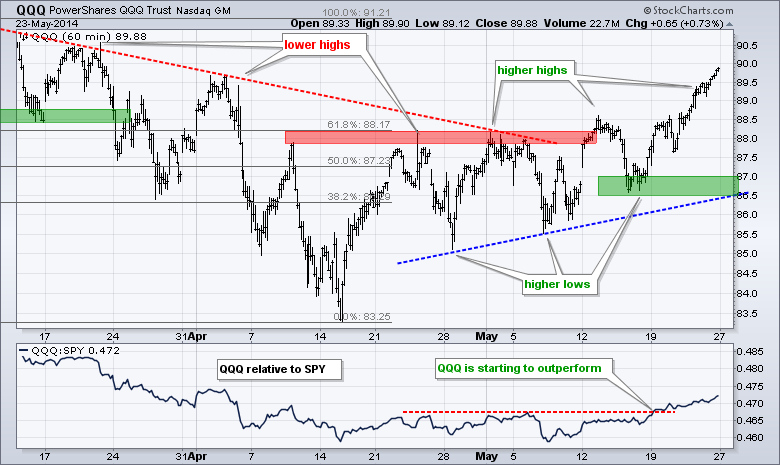
QQQ showed relative strength last week with a break above the mid May high and surge towards 90. The price relative (QQQ:SPY ratio) broke out early last week and is not in an uptrend. QQQ may seem overbought after an advance from 86.5 to 89.9, but the ETF is by no means weak.
**************************************************************
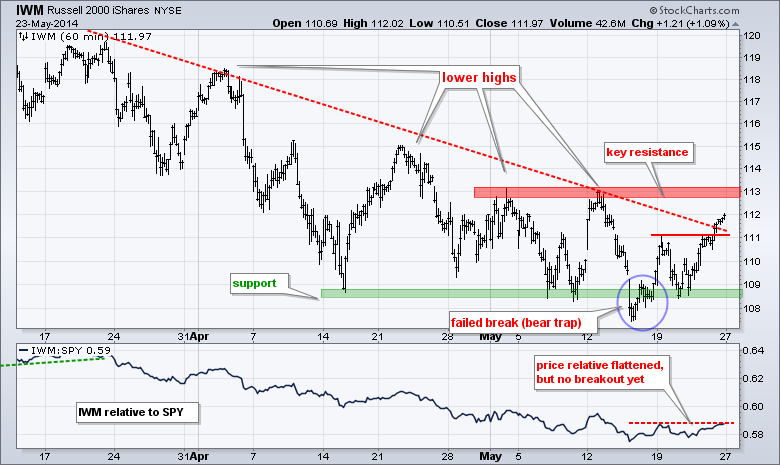
IWM is quietly trying for a breakout. First, the ETF failed to hold its support break and bounced above 110 last Monday. Second, the ETF successfully tested support in the 108.5 area mid week. Third, IWM broke last Monday's high with a surge above 111 on Friday. A break above key resistance in the 113 area would complete the trend reversal. The indicator window shows the price relative flattening over the last two weeks as IWM stopped underperforming SPY for a short time. A breakout is needed to show relative strength though.
**************************************************************
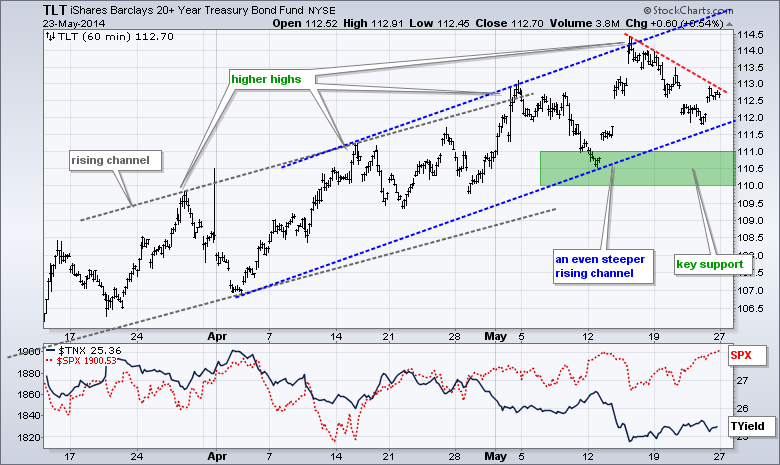
The 20+ YR T-Bond ETF (TLT) is at an interesting juncture as it tests the lower trend line of a rising channel. Strength in Treasuries has perhaps weighed on small-caps (IWM) and the consumer discretionary sector (XLY). A little weakness would be welcome news for these two groups because it would signal confidence in the economy. A move above 113 would break the short down swing and keep the bigger uptrend alive. A move below 111.5 would break the channel trend line and set up a more important test in the 110-111 area.
**************************************************************
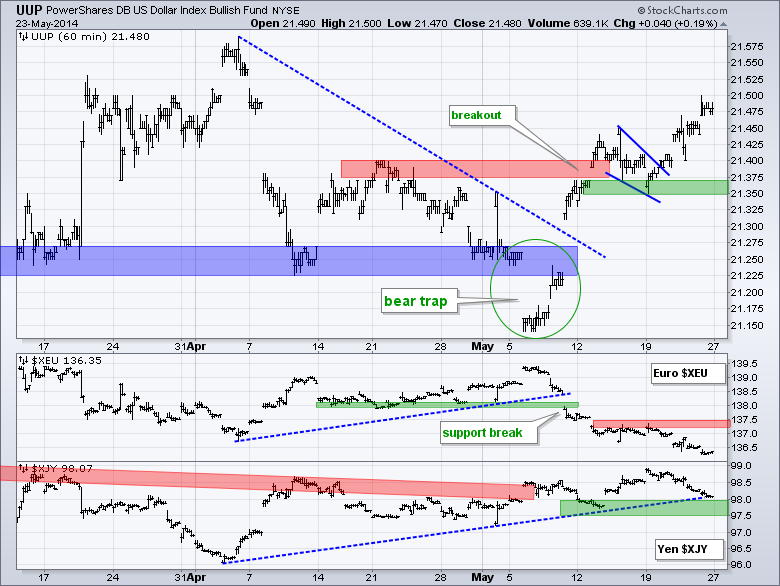
The US Dollar ETF (UUP) is looking more and more bullish. First, UUP failed to hold the support break and formed a bear trap in early May. Second, the ETF broke out with a surge above 21.40. Third, the ETF consolidated and then continued higher with a surge above 21.45 last week. Last week's lows now mark first support in the 21.35 area. The Euro Index ($XEU) sank below its early April low and shows weakness. Key resistance is set at 137.50
**************************************************************
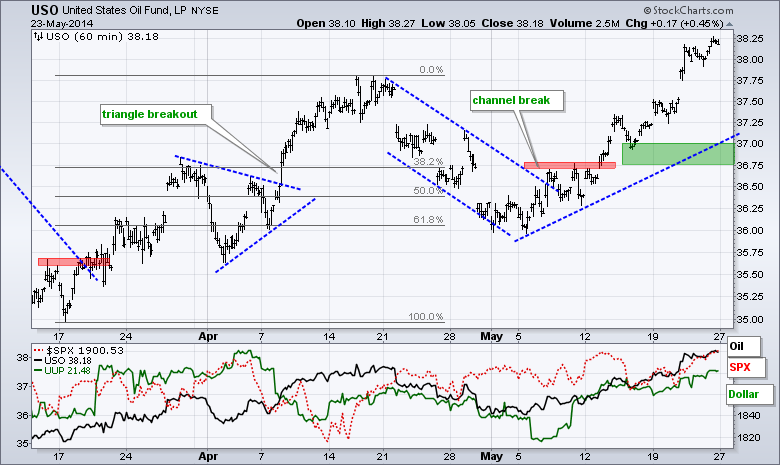
No change. The USO Oil Fund (USO) continued its advance with a move to 37.50 on Monday. Note that USO broke channel resistance in early May and this signaled a continuation of the prior advance (mid March to mid April). The May trend line, broken resistance and a buffer combine to mark key support in the 36.5-36.75 area.
**************************************************************
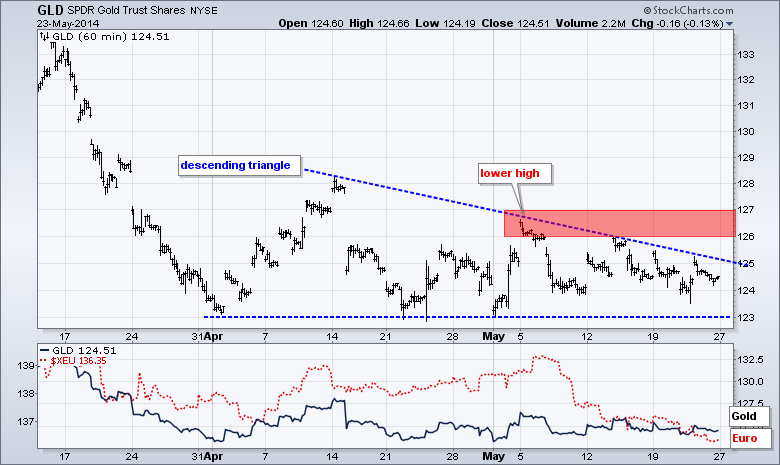
No change. Gold could not breakout with tensions in Ukraine and must now contend with a strengthening Dollar. The Gold SPDR (GLD) remains with a descending triangle, which is a bearish continuation pattern. The lower high in early May indicates that buying pressure was not strong enough to trigger a breakout or upside follow through to the bounce. The relatively equal lows represent the demand line. A break here would signal a victory for supply and target a move to the 118 area.
***************************************************************
Key Reports and Events (all times Eastern):
Tue - May 27 - 08:30 - Durable Goods Orders
Tue - May 27 - 09:00 - Case-Shiller 20-city Housing Index
Tue - May 27 - 09:00 - FHFA Housing Price Index
Tue - May 27 - 10:00 - Consumer Confidence
Wed - May 28 - 07:00 - MBA Mortgage Index
Thu - May 29 - 08:30 - Initial Jobless Claims
Thu - May 29 - 08:30 - GDP
Thu - May 29 - 10:00 - Pending Home Sales
Thu - May 29 - 10:30 - Natural Gas Inventories
Thu - May 29 - 11:00 - Crude Oil Inventories
Fri - May 30 - 08:30 - Personal Income & Spending
Fri - May 30 - 09:45 - Chicago PMI
Fri - May 30 - 09:55 - Michigan Sentiment
This commentary and charts-of-interest are designed to stimulate thinking. This analysis is not a recommendation to buy, sell, hold or sell short any security (stock ETF or otherwise). We all need to think for ourselves when it comes to trading our own accounts. First, it is the only way to really learn. Second, we are the only ones responsible for our decisions. Think of these charts as food for further analysis. Before making a trade, it is important to have a plan. Plan the trade and trade the plan. Among other things, this includes setting a trigger level, a target area and a stop-loss level. It is also important to plan for three possible price movements: advance, decline or sideways. Have a plan for all three scenarios BEFORE making the trade. Consider possible holding times. And finally, look at overall market conditions and sector/industry performance.


