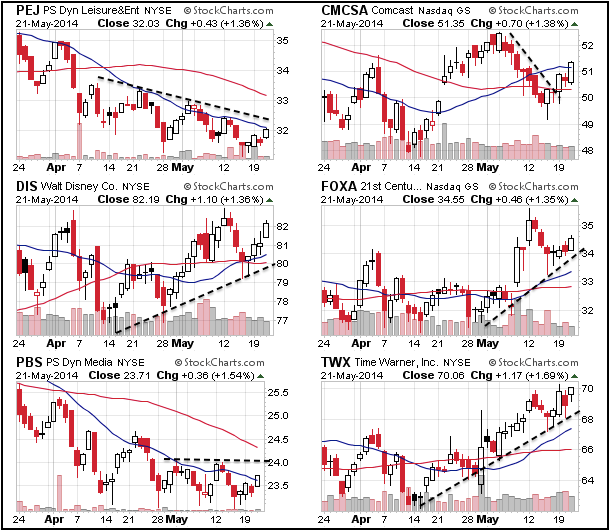
Stocks rebounded on Wednesday with large-caps leading the way. The Dow Diamonds (DIA) and S&P 100 ETF (OEF) rose around 1%. All sectors were up with consumer discretionary and industrials leading. Note, however, that the Retail SPDR (XRT) and the Home Construction iShares (ITB) did not lead the consumer discretionary sector and ended the day with paltry gains. Instead, the Leisure and Entertainment ETF (PEJ) and Media ETF (PBS) led with gains of 1.36% and 1.54%, respectively. Chalk it up to Disney (DIS), Comcast (CMCSA), 21 Century Fox (FOXA) and Time Warner (TWX). Energy stocks were also strong as Spot Light Crude ($WTIC) surged towards its March-April highs. Note that the USO Oil Fund (USO) broke these highs, but $WTIC has yet to break out and is at resistance.
**This chart analysis is for educational purposes only, and should not
be construed as a recommendation to buy, sell or sell-short said securities**
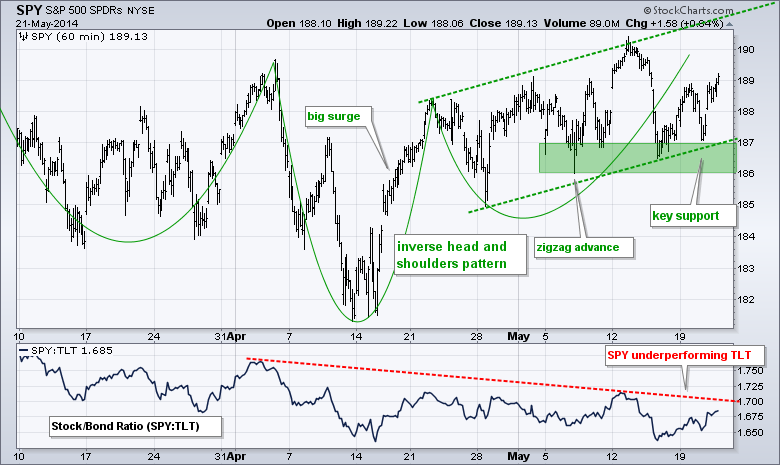
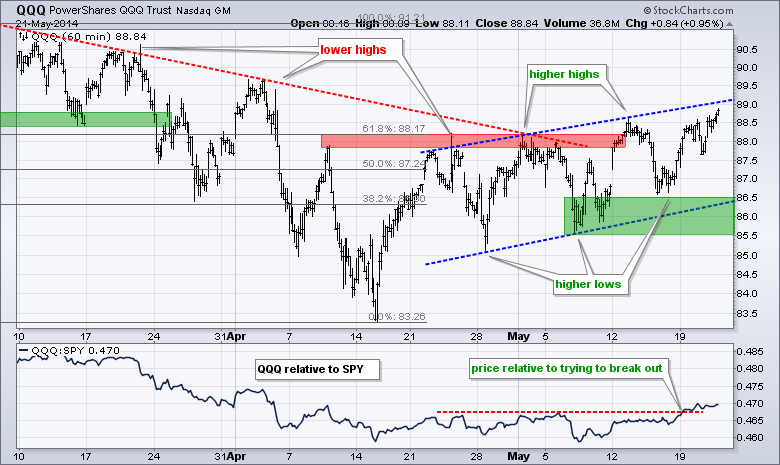
There was not much change on the intraday charts. SPY and QQQ remain in zigzag uptrends over the last several weeks, while IWM remains in a downtrend. TLT pulled back within its uptrend and is near trend line support. UUP continues to consolidate after the big surge. USO remains in an uptrend after the mid May breakout. GLD remains within a bearish descending triangle.
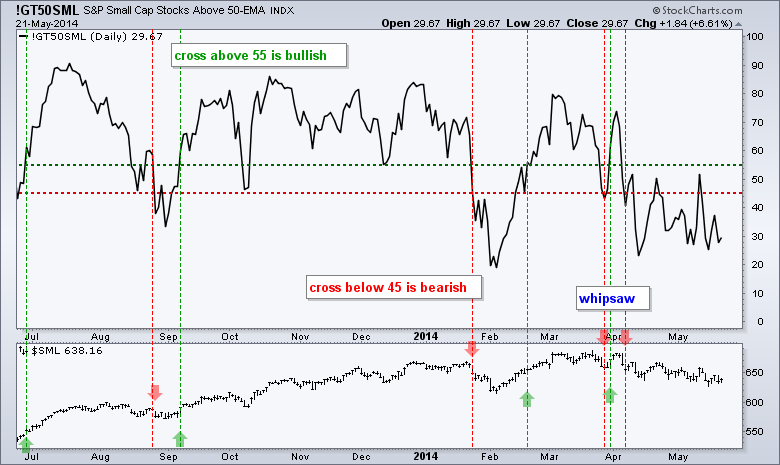
For the broader stock market, small-caps remain the big drag and I am watching various indicators for signs of strength. The chart below shows the percentage of S&P SmallCap 600 stocks above their 50-day moving average. A cross above 55 is bullish and a cross below 45 is bearish. This is not a perfect indicator and it should be used in conjunction with other analysis techniques. On a medium-term basis, I do not see small caps turning around until this indicator breaks above 55% again.
**************************************************************
No change. SPY bounced off the support zone to keep the zigzag advance alive. This move reinforces support in the 186-187 area. Even though the overall uptrend is still in place, SPY is underperforming TLT and small-caps continued to weigh on the market overall. A break below support at 186 would reverse the short-term upswing and signal that large-caps are coming under selling pressure.
**************************************************************
No change. QQQ remains in a short-term uptrend with a series of higher highs and higher lows the last few weeks. The ETF even managed to hold above the early May low last week and bounce. I will leave key support in the 85.5-86 area. Overall, a rising wedge could be forming from the mid April lows to the mid May high. A support break would signal a continuation of the prior decline (early March to mid April).
**************************************************************
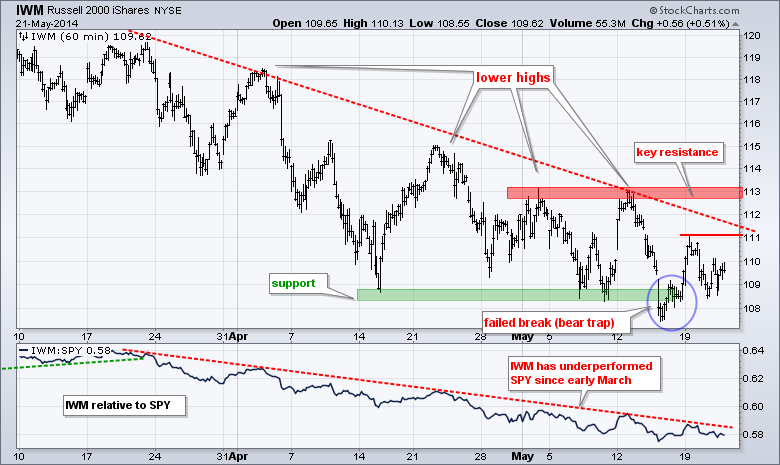
No change. IWM fell right back to the support zone with a sharp decline on Tuesday. The bear trap is still possible, but IWM must hold Tuesday's low and bounce from here. The overall trend remains down and IWM continues to show relative weakness as the price relative (IWM:SPY ratio) trends lower. I will leave key resistance in the 113 area and require a break above the May highs for a convincing trend reversal.
**************************************************************
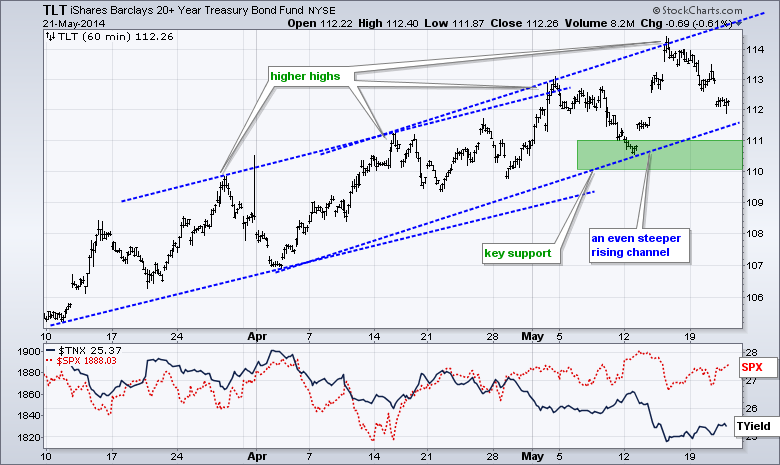
No change. The 20+ YR T-Bond ETF (TLT) fell sharply and this facilitated a rally in the Russell 2000 and Nasdaq. The trend remains up as TLT rises within a channel since early April. Note that this channel is slightly steeper than the channel from mid March to mid April. The lower trend line, mid May low and a buffer combine to mark a support zone in the 110-111 area.
**************************************************************
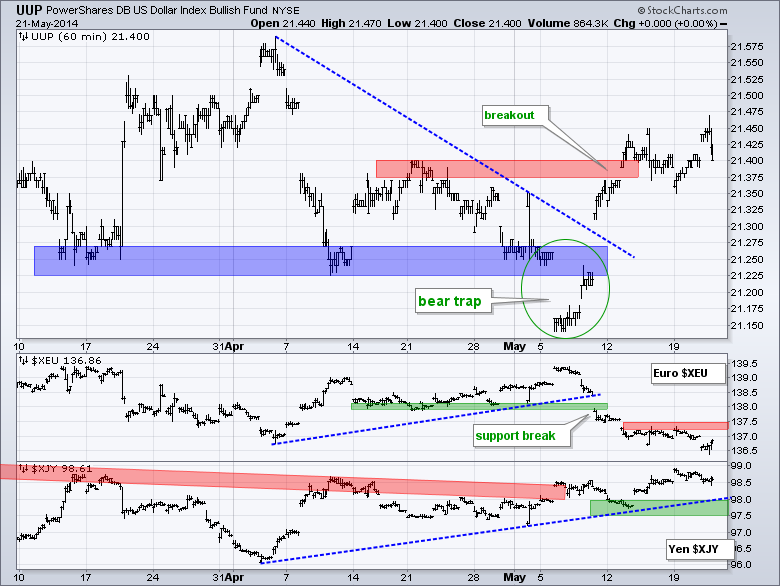
No change. The US Dollar ETF (UUP) continued higher and broke above the late April highs. The bear trap provided the first sign of a trend reversal and this follow through breakout signals the start of an uptrend. Dollar strength is built on Euro weakness as the Euro Index ($XEU) broke support with a sharp decline over the last few days.
**************************************************************
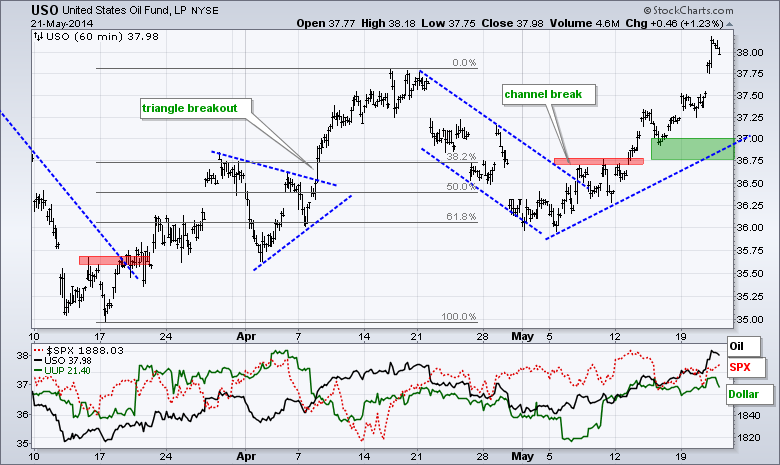
No change. The USO Oil Fund (USO) continued its advance with a move to 37.50 on Monday. Note that USO broke channel resistance in early May and this signaled a continuation of the prior advance (mid March to mid April). The May trend line, broken resistance and a buffer combine to mark key support in the 36.5-36.75 area.
**************************************************************
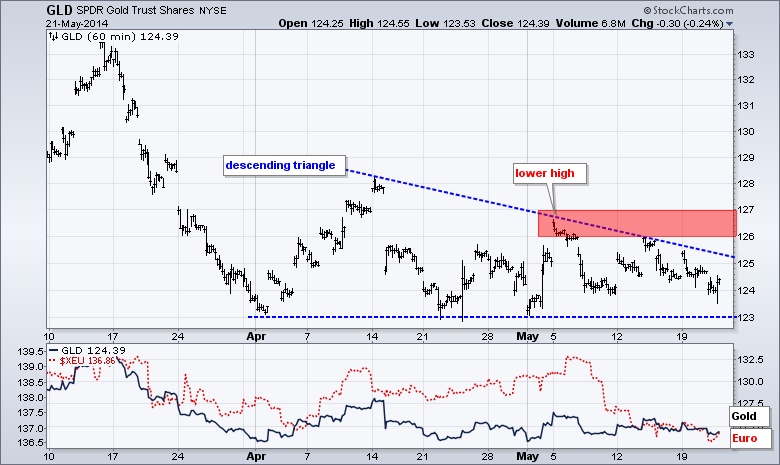
No change. Gold could not breakout with tensions in Ukraine and must now contend with a strengthening Dollar. The Gold SPDR (GLD) remains with a descending triangle, which is a bearish continuation pattern. The lower high in early May indicates that buying pressure was not strong enough to trigger a breakout or upside follow through to the bounce. The relatively equal lows represent the demand line. A break here would signal a victory for supply and target a move to the 118 area.
***************************************************************
Key Reports and Events (all times Eastern):
Thu - May 22 - 08:30 - Initial Jobless Claims
Thu - May 22 - 10:00 - Existing Home Sales
Thu - May 22 - 10:00 - Leading Economic Indicators
Thu - May 22 - 10:30 - Natural Gas Inventories
Fri - May 23 - 10:00 - New Home Sales
This commentary and charts-of-interest are designed to stimulate thinking. This analysis is not a recommendation to buy, sell, hold or sell short any security (stock ETF or otherwise). We all need to think for ourselves when it comes to trading our own accounts. First, it is the only way to really learn. Second, we are the only ones responsible for our decisions. Think of these charts as food for further analysis. Before making a trade, it is important to have a plan. Plan the trade and trade the plan. Among other things, this includes setting a trigger level, a target area and a stop-loss level. It is also important to plan for three possible price movements: advance, decline or sideways. Have a plan for all three scenarios BEFORE making the trade. Consider possible holding times. And finally, look at overall market conditions and sector/industry performance.


