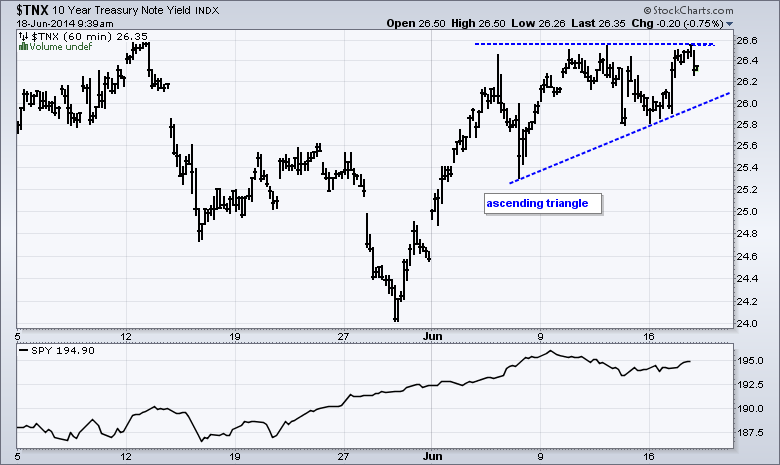
It seems that there are higher yields in our future. The economy is plugging along, the labor market is improving and inflation is on target. The Consumer Price Index (CPI) rose .4% in May and this was the largest increase since February 2013. It also puts the CPI on target for a 2% annual gain, which matches the Fed's inflation target. The economy, job market and CPI are looking pretty normal, but the 10-YR Treasury Yield ($TNX) is still at relatively low levels. 10-year yields were in the 4-5% range from 2004 until late 2007 and then fell to 1.5% in mid 2012. The yield surged from 1.65% to 3% in less than 5 months (May to Sep 2013). $TNX has been in a trading (2.4% to 3%) for over a year now. Most recently, the 10-YR Treasury Yield is bouncing off range support and could be headed back to the 3% area. Notice that an ascending triangle formed on the 60 minute chart and a break above 26.6 (2.66%) would signal a continuation higher. There is no real change on the other charts. The FOMC issues its policy statement this afternoon and we could see some volatility around 2PM.
**This chart analysis is for educational purposes only, and should not
be construed as a recommendation to buy, sell or sell-short said securities**
*************************************************************
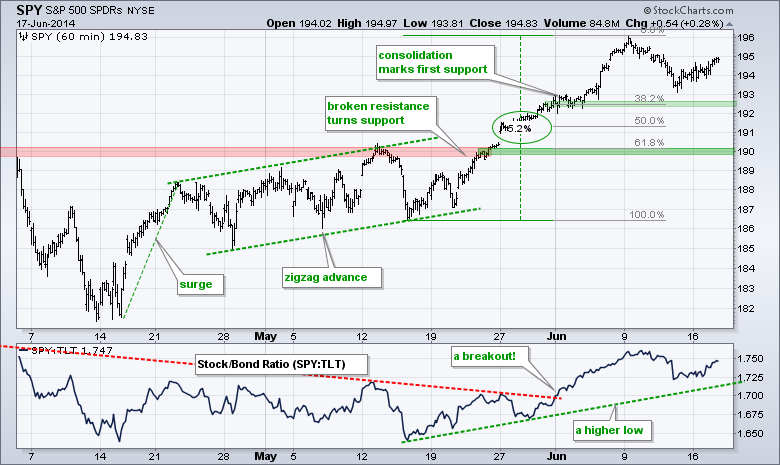
No change. SPY remains in an uptrend since the April surge above 187. After a 5.2% advance to 196, SPY corrected with a decline to the 193 area, which is just above the first support zone. I am marking first support in the 192-193 area (38% retracement and early June consolidation. Further down, broken resistance and the 61% retracement mark support in the 190 area. If I had to make a guess, I would guess that this correction will zigzag lower and we could see a reversal in the 191 area (between the two support zones).
**************************************************************
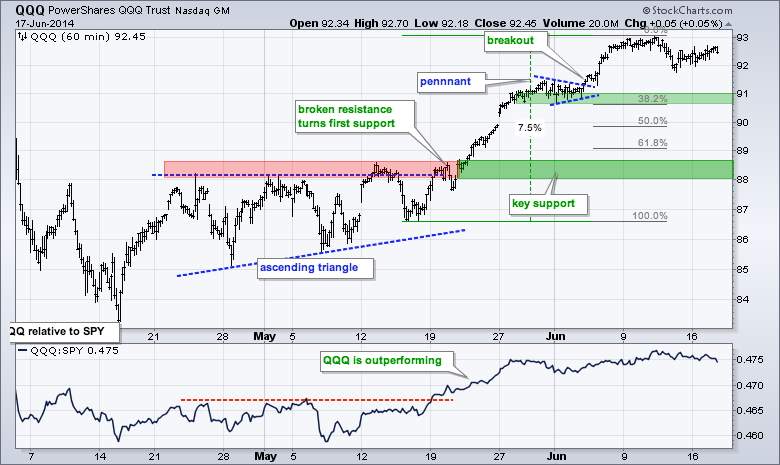
No change. QQQ surged over 7% with the move to 93 and then fell back to 92 last week. This is not much of a correction or pullback. QQQ remains the strongest of the big three (IWM, SPY, QQQ) because it has the shallowest pullback. The pennant lows and 38% retracement combine to mark first support in the 91 area. I will leave key support in the 88-88.5 area for now.
**************************************************************
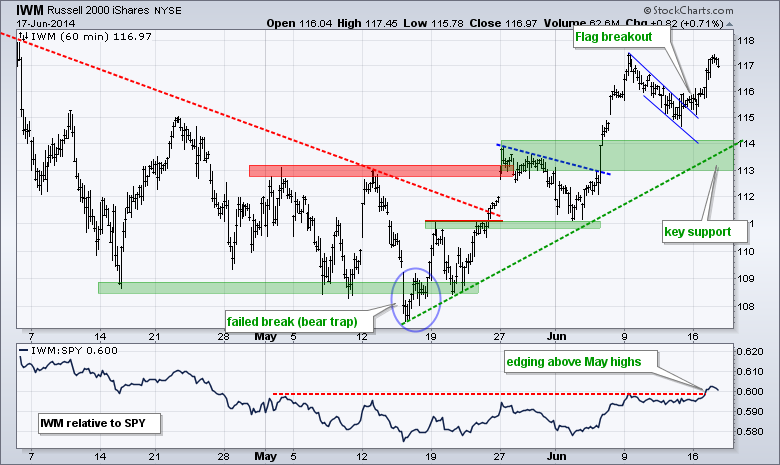
No change. IWM broke flag resistance on Friday and the breakout held with further gains this week. Broken resistance and the mid May trend line combine to mark support in the 113-114 area. The indicator window shows the price relative edging above the May highs as small-caps start to outperform large-caps again.
**************************************************************
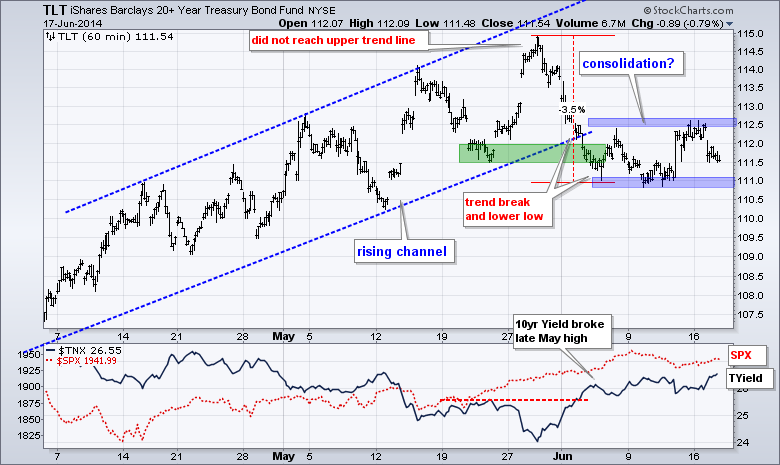
No change. TLT broke down with a move to 111 in early June and then moved into a rather choppy range. At this point, I think we need to establish a directional bias: up or down. I have a downward bias on TLT because of the channel break and lower low in early June. This means the choppy range is a correction within a bigger downtrend. This thesis would be seriously tested with a break above 112.7. A break below the consolidation lows would signal a continuation lower.
**************************************************************
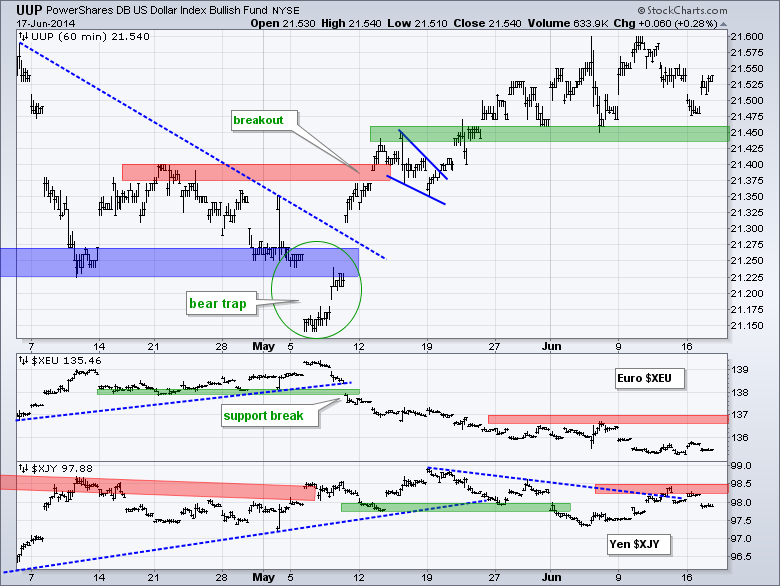
No change. The US Dollar ETF (UUP) got another bounce as the Euro Index ($XEU) sank below 135.5 last week. UUP held its breakout as broken resistance turned support in the 21.45 area. This is the first support zone to watch for a break down. I am lowering key resistance for the Euro to 137. In the lower indicator window, the Yen Index ($XJY) bounced above 98 and is on the verge of breaking a four week trend line. Strength in the Yen would be negative for the Nikkei 225 ($NIKK).
**************************************************************
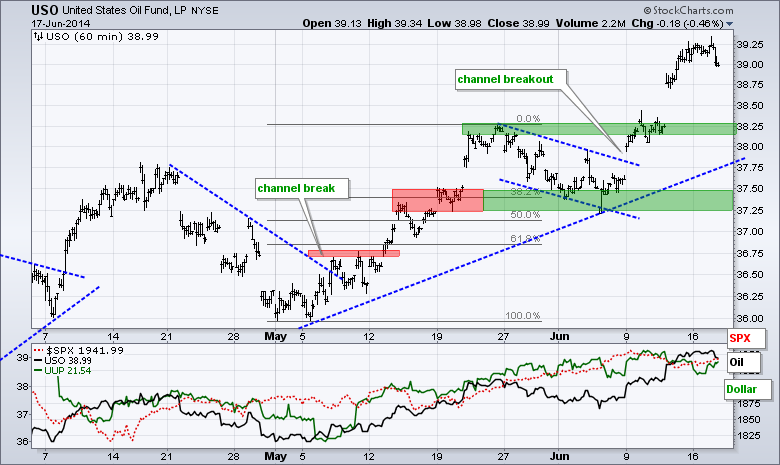
No change. USO continued higher with a surge above 39 and Spot Light Crude ($WTIC) broke above a key resistance zone on the daily chart. Broken resistance in the 38.25 area turns first support for USO. I will leave key support in the 37.25-37.5 area for now.
**************************************************************
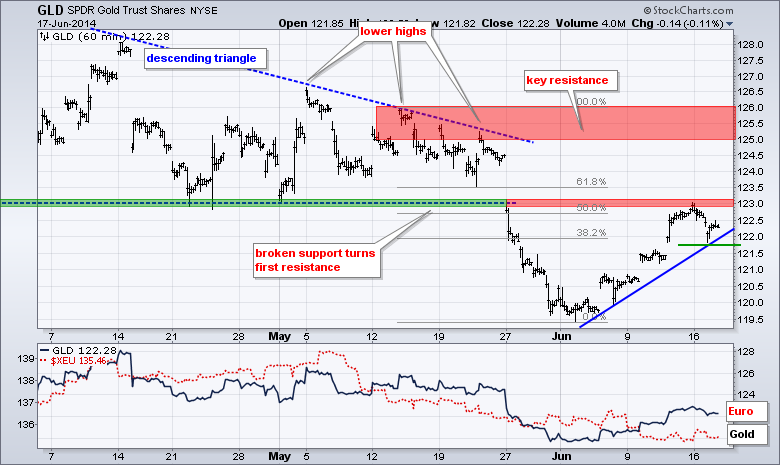
No change. Gold got a big bounce last week as worries on Iraq pushed money into this safe haven. There was probably some short covering as well. Gold, however, remains in a medium-term and long-term downtrend. Last week's surge may be enough to reverse the short-term downtrend, but resistance is at hand from broken support and the 50-62% retracement zone.
***************************************************************
Key Reports and Events (all times Eastern):
Wed - Jun 18 - 07:00 - MBA Mortgage Index
Wed - Jun 18 - 10:30 - Crude Oil Inventories
Wed - Jun 18 - 14:00 - FOMC Policy Statement
Thu - Jun 19 - 08:30 - Initial Jobless Claims
Thu - Jun 19 - 10:00 - Philadelphia Fed Report
Thu - Jun 19 - 10:00 - Leading Economic Indicators
Thu - Jun 19 - 10:30 - Natural Gas Inventories
Fri - Jun 20 - 10:30 - Happy Friday!
This commentary and charts-of-interest are designed to stimulate thinking. This analysis is not a recommendation to buy, sell, hold or sell short any security (stock ETF or otherwise). We all need to think for ourselves when it comes to trading our own accounts. First, it is the only way to really learn. Second, we are the only ones responsible for our decisions. Think of these charts as food for further analysis. Before making a trade, it is important to have a plan. Plan the trade and trade the plan. Among other things, this includes setting a trigger level, a target area and a stop-loss level. It is also important to plan for three possible price movements: advance, decline or sideways. Have a plan for all three scenarios BEFORE making the trade. Consider possible holding times. And finally, look at overall market conditions and sector/industry performance.


