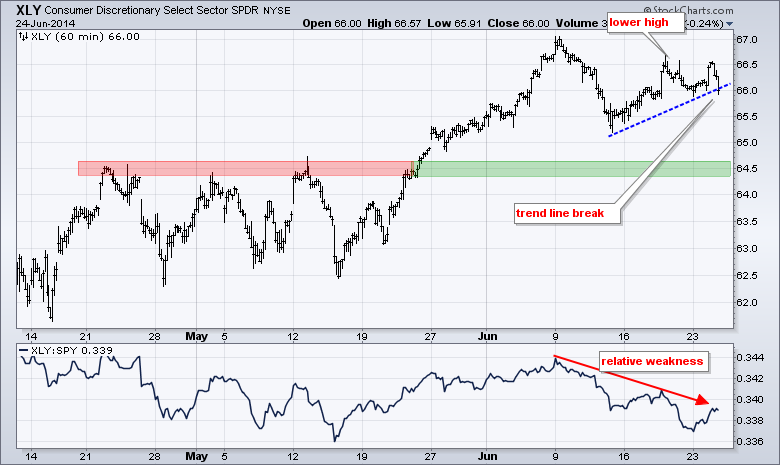
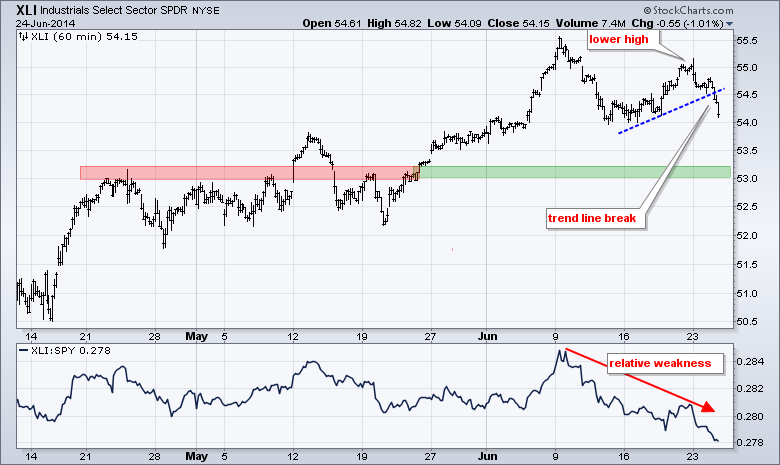
Stocks started the day strong, but peaked near midday and fell in the afternoon. The major index ETFs formed outside days with a bearish bias. This means Tuesday's high-low range was outside Monday's high-low range and Tuesday's close was weak. One day does not a trend change make and the short-term trends remain up because IWM, QQQ and SPY are still well above their first support zones. If we had to look for an excuse, other than an overdue correction, we can point to tensions in Iraq, which appear to be growing. Note that Treasury bonds shook off recent inflationary rumblings and surged in a flight to safety. The charts below show the Consumer Discretionary SPDR (XLY) and Industrials SPDR (XLI). These these are the two weakest sectors over the last few weeks. XLY peaked below its early June high and broke the blue trend line on Tuesday. This could give way to further weakness towards the 64.5 area. The XLI chart shows similar characteristics.
**This chart analysis is for educational purposes only, and should not
be construed as a recommendation to buy, sell or sell-short said securities**
*************************************************************
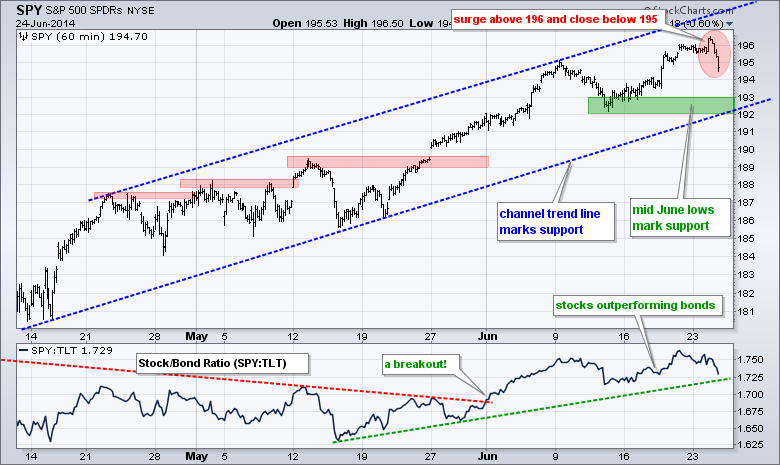
SPY moved above 196 in early trading, but quickly reversed and close below 195. An outside day formed on the daily chart and this could signal overhead resistance in the 196 area. The short-term trend remains up with the rising channel defining this advance. The lower trend line and mid June low combine to mark key support in the 192-193 area.
**************************************************************
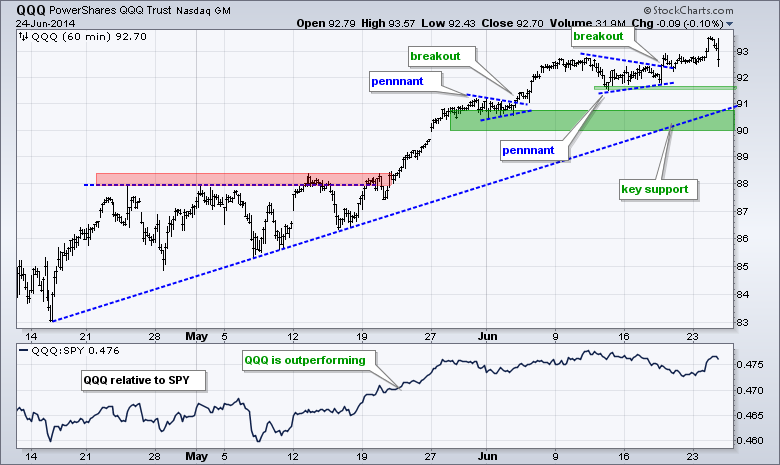
QQQ surged above 93.5 and then fell to close at 92.70. It was an intraday reversal, but the move was not enough to negate the pennant breakout or even challenge the first support level. The pennant lows mark first support at 91.50. The early June pennant, mid April trend line and a buffer mark key support in the 90-91 area.
**************************************************************
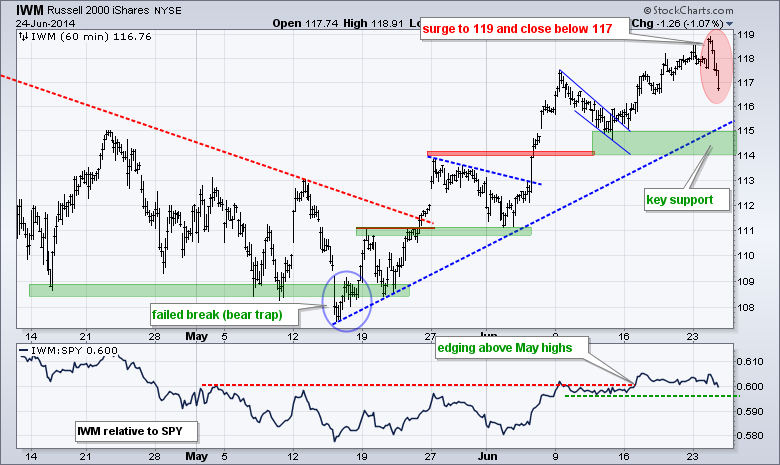
IWM formed an even bigger intraday reversal with a surge to 119 and a close below 117. The move looks drastic for one day, but the overall trend remains up and the ETF was entitled to a correction. The mid May trend line marks first support. The mid June low and broken resistance combine to mark a key support zone in the 114-115 area.
**************************************************************
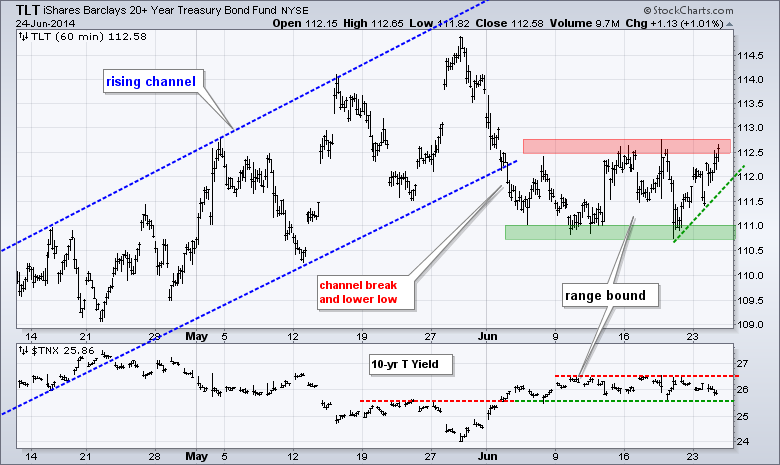
The intraday reversal in stocks put a bid into Treasuries as TLT surged to the mid June highs. This move negates the rising wedge so I removed it from the chart. Overall, TLT remains within a very choppy consolidation with widening swings. The current swing (three days) is up with support at 111.9. I will also be watching the 10-YR Treasury Yield ($TNX) for a signal (indicator window). It is also range bound. A break above the mid June highs would be bullish for yields and bearish for Treasuries. A break below support would be bearish for yields and bullish for Treasuries.
**************************************************************
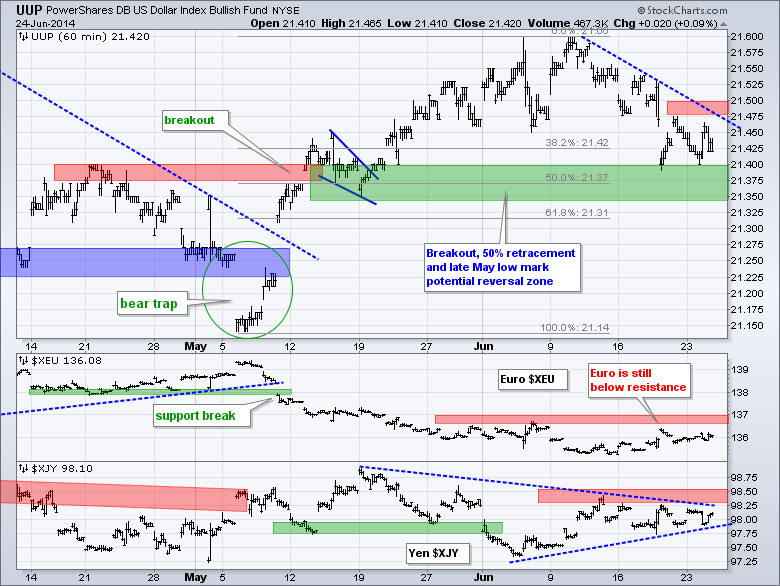
No change. The US Dollar ETF (UUP) fell over the last two weeks and the immediate trend is down. This still looks like a correction after the breakout-surge in May. The breakout zone, 50% retracement and late May low combine to mark a potential reversal zone in the 21.35-21.40 area. The Euro Index ($XEU) is still below resistance at 137, a break of which would be Euro bullish and Dollar bearish.
**************************************************************
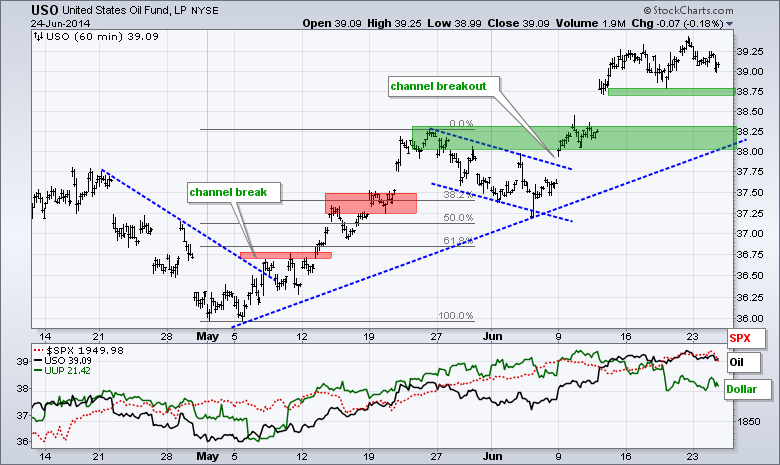
No change. The USO Oil Fund (USO) broke out in early June and surged above 39. The situation in Iraq is likely to remain unstable for a while and this will most affect Iraqi production. This could put a floor on oil prices and limit declines. Last week's low mark first support in the 38.75 area. Broken resistance and the May trend line mark key support in the 38-38.25 area.
**************************************************************
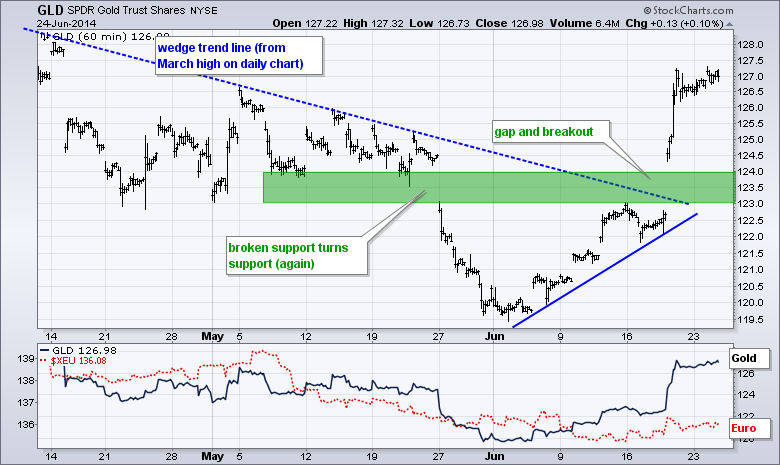
No change. The Gold SPDR (GLD) blew through this resistance zone with a gap and surge above 126. On the daily chart, GLD held above its December low and broke wedge resistance to signal a continuation of the surge from late December to mid March. GLD is obviously overbought right now and the broken resistance zone turns first support in the 123-124 area.
***************************************************************
Key Reports and Events (all times Eastern):
Wed - Jun 25 - 07:00 - MBA Mortgage Index
Wed - Jun 25 - 08:30 - Durable Goods Orders
Wed - Jun 25 - 08:30 - GDP
Wed - Jun 25 - 10:30 - Crude Oil Inventories
Thu - Jun 26 - 08:30 - PCE Price Index
Thu - Jun 26 - 08:30 - Initial Jobless Claims
Thu - Jun 26 - 08:30 - Personal Income & Spending
Thu - Jun 26 - 10:30 - Natural Gas Inventories
Fri - Jun 27 - 09:55 - Michigan Sentiment
This commentary and charts-of-interest are designed to stimulate thinking. This analysis is not a recommendation to buy, sell, hold or sell short any security (stock ETF or otherwise). We all need to think for ourselves when it comes to trading our own accounts. First, it is the only way to really learn. Second, we are the only ones responsible for our decisions. Think of these charts as food for further analysis. Before making a trade, it is important to have a plan. Plan the trade and trade the plan. Among other things, this includes setting a trigger level, a target area and a stop-loss level. It is also important to plan for three possible price movements: advance, decline or sideways. Have a plan for all three scenarios BEFORE making the trade. Consider possible holding times. And finally, look at overall market conditions and sector/industry performance.


