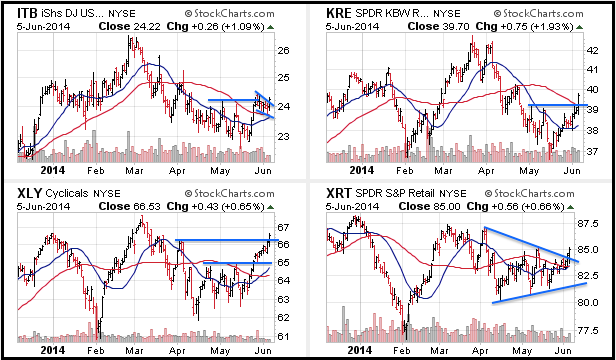
Stocks caught a bid with the Russell 2000 ETF and Russell MicroCap iShares leading the charge. Both gained over 2% and easily outperformed the S&P 500 SPDR, which gained just .60% on the day. All sectors were up with industrials and finance leading. Among the key industry group ETFs to watch, the Home Construction iShares surged over 1% and triggered a flag breakout. The Regional Bank SPDR surged almost 2% and broke its May highs. The Retail SPDR advanced just .66%, but broke a triangle trend line and is challenging its May highs. The Consumer Discretionary SPDR is also perking up with a surge above its April highs. Even though the much-anticipated employment report is today, it looks like the market made its move on Thursday.
**This chart analysis is for educational purposes only, and should not
be construed as a recommendation to buy, sell or sell-short said securities**
*************************************************************
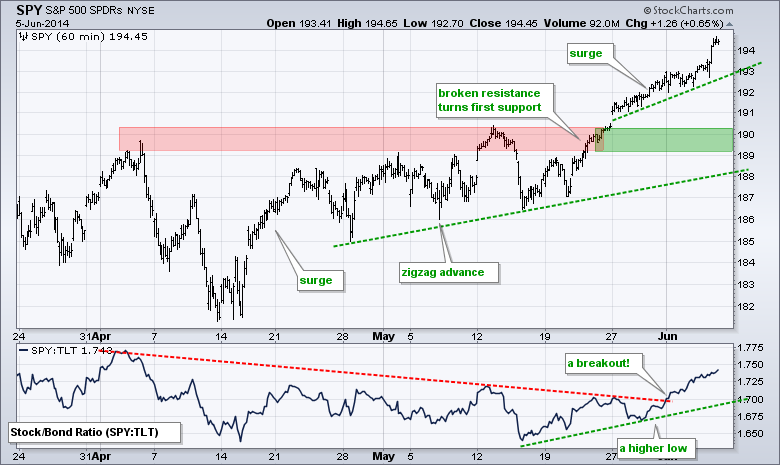
SPY accelerated higher with a surge above 194. The gain was not that impressive on a percentage basis, but it was enough to record yet another new high. I am raising key support to the 189-190 area, which is marked by broken resistance. The SPY:TLT ratio continued higher and stocks have now outperformed bonds since mid May.
**************************************************************
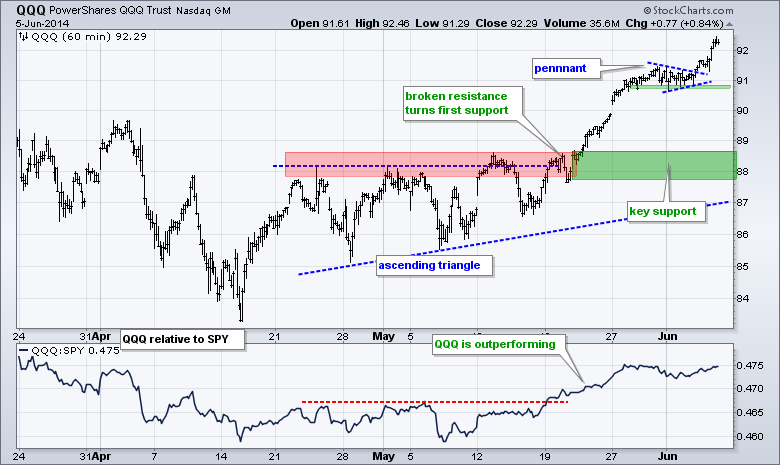
QQQ broke pennant resistance and surged above 92 on Thursday. The pennant lows now mark the first support zone to watch. Overall, the trend is nothing but up with broken resistance turning into the first significant support zone.
**************************************************************
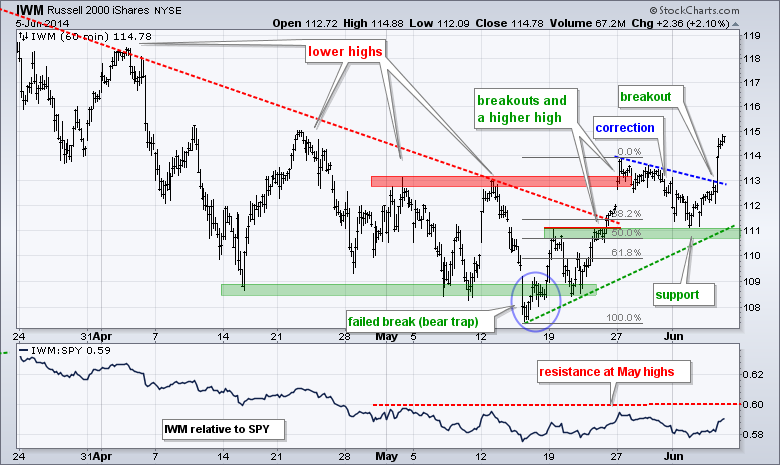
IWM put together a pretty nice breakout, pullback and resumption sequence. The ETF surged above resistance in the 111 area and exceeded its mid May high. IWM then pulled back to broken resistance and retraced 50% of the prior surge. Support in the 111 area held and the ETF broke out again with a big move above 113 on Thursday. This affirms support in the 110.5-111 area.
**************************************************************
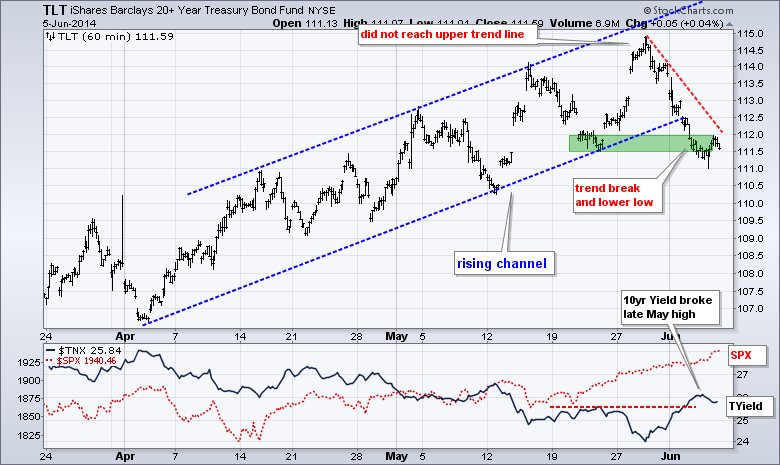
No change. TLT broke the channel trend line and exceeded its prior low to signal the start of a downtrend. The ETF, however, is short-term oversold after a 3% decline the last five days. This may give way to an oversold bounce, but I think the overall trajectory is down for Treasuries right now. Notice that the 10-YR Treasury Yield ($TNX) broke above its late May highs.
**************************************************************
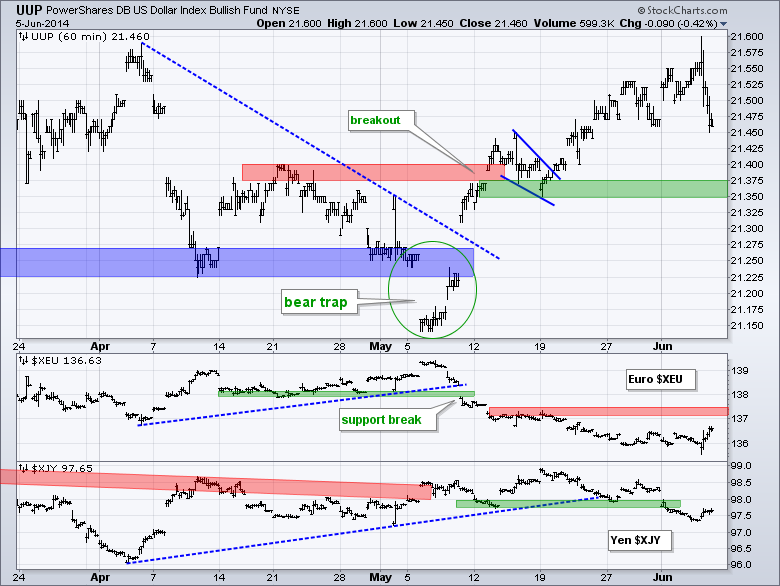
The Euro surged and the Dollar fell after the European Central Bank (ECB) announced its new measures to fight disinflation. I would not call it deflation just yet. The ECB, however, stopped short of a US-style bond buying program (QE). Perhaps the market was expecting QE and did not get it. In any case, this policy change from the ECB was anticipated and we now have a sell-the-rumor and buy-the-news scenario. Traders were short heading into the announcement and covered afterwards. Today's move does not change the overall trajectory for the Dollar. UUP remains in an uptrend with first support in the 21.35-21.375 area. The Euro Index ($XEU) is in a downtrend with resistance at 137.5
**************************************************************
Oil does not know what to think right now. The Dollar is rising and this is oil negative. Stocks are rising and this is oil positive. On the price chart, the USO Oil Fund (USO) is in an uptrend overall with a higher low in early May and higher high in late May. The decline back to the 37.2-37.4 area looks like a correction. This move retraced 38-50% and formed a falling channel. Look for a break above 38 to reverse this fall and signal a continuation of the bigger uptrend.

**************************************************************
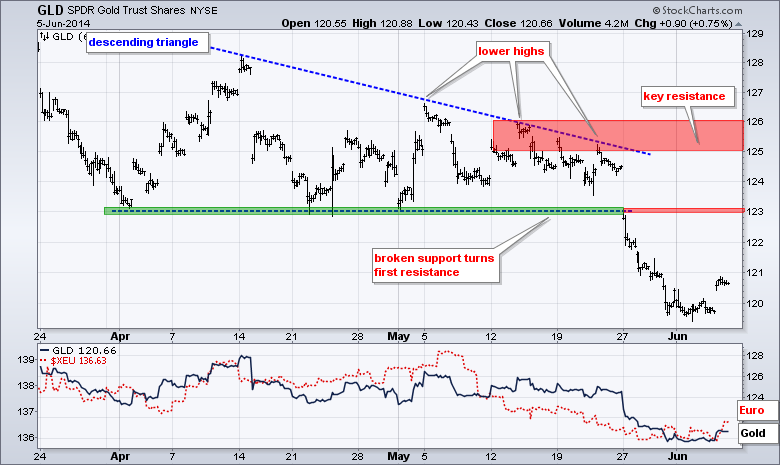
Gold got a bounce as the Dollar fell and Euro rose. I still view this as an oversold bounce within a bigger downtrend. Broken support in the 123 area turns first resistance. I will leave key resistance in the 125-126 area.
***************************************************************
Key Reports and Events (all times Eastern):
Thu - Jun 05 - 07:30 - Challenger Job Report
Thu - Jun 05 - 08:30 - Initial Jobless Claims
Thu - Jun 05 - 10:30 - Natural Gas Inventories
Fri - Jun 06 - 08:30 - Employment Report
This commentary and charts-of-interest are designed to stimulate thinking. This analysis is not a recommendation to buy, sell, hold or sell short any security (stock ETF or otherwise). We all need to think for ourselves when it comes to trading our own accounts. First, it is the only way to really learn. Second, we are the only ones responsible for our decisions. Think of these charts as food for further analysis. Before making a trade, it is important to have a plan. Plan the trade and trade the plan. Among other things, this includes setting a trigger level, a target area and a stop-loss level. It is also important to plan for three possible price movements: advance, decline or sideways. Have a plan for all three scenarios BEFORE making the trade. Consider possible holding times. And finally, look at overall market conditions and sector/industry performance.


