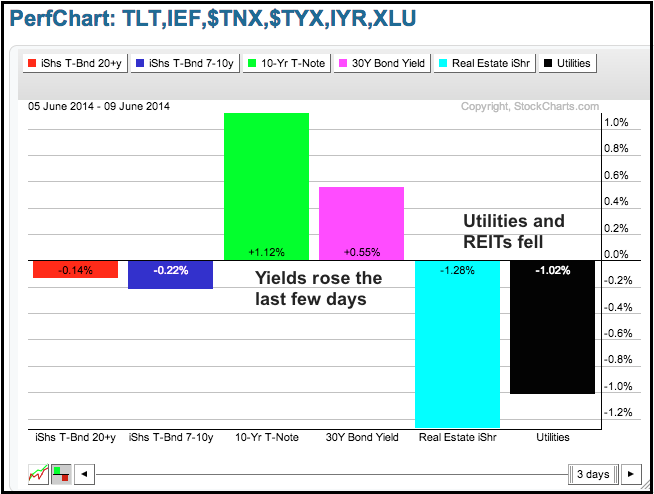
It was a mixed day on Wall Street as the Nasdaq 100 ETF edged higher (.17%) and the S&P 500 SPDR edged lower (.01%). The gains and losses in the major index ETFs were insignificant and Tuesday can be called a consolidation day. The sectors were also mixed with insignificant gains and losses. Of note, utilities were under a little selling pressure as the 10-YR Treasury Yield rose to 2.655%. Also note that the 20+ YR T-Bond ETF reversed its short-term uptrend with a sharp decline this month and the 10-YR Treasury Yield would be headed back to the 3% area. This is not high by historical standards, but it could put pressure on groups that rose as yields declined, such as REITs and utilities. Elsewhere, techs remained strong with the Semiconductor SPDR hitting another new high and Facebook leading the Internet ETF.
**This chart analysis is for educational purposes only, and should not
be construed as a recommendation to buy, sell or sell-short said securities**
*************************************************************
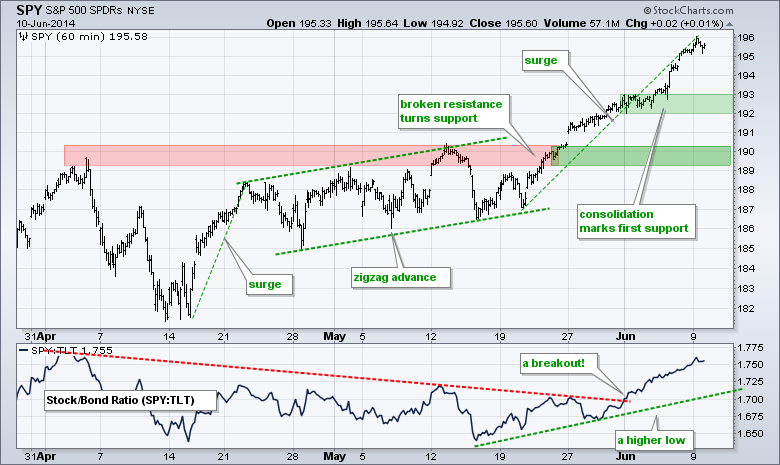
No change. SPY remains in a clear uptrend, but is now up over 4% in three weeks. The ETF is getting a little overbought and this could bring about a corrective period, which could entail a trading range or a pullback. The consolidation from early last week marks first support in the 192-193 area. Broken resistance turns into key support in the 189-190 area. The SPY:TLT ratio formed a higher low in late May and broke out in early June. This means stocks are outperforming bonds, which is positive for stocks.
**************************************************************
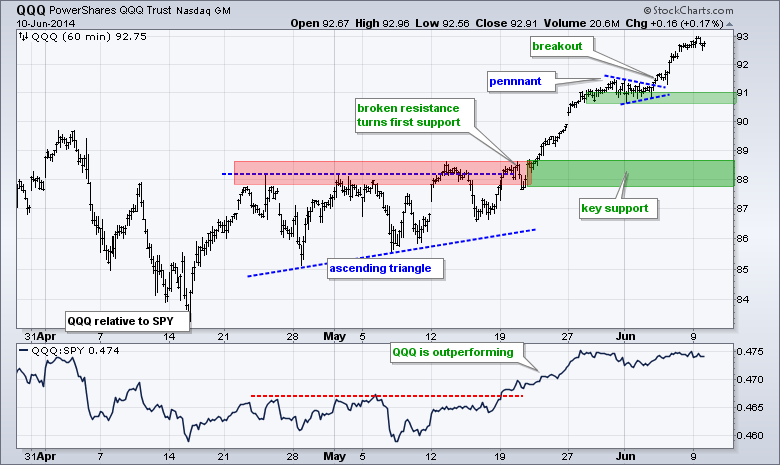
No change. QQQ broke pennant resistance and resumed its uptrend with a surge to new highs. The pennant lows now mark first support in the 90.7-91 area. Like SPY, QQQ is getting a little overbought after a 5+ percent advance in three weeks. These overbought conditions could give way to a corrective period or choppy trading in the days/weeks ahead. Key support remains in the 88 area for now.
**************************************************************
No change. IWM is not outperforming SPY yet, but the ETF got a breakout with its two-day surge to 116. Overall, IWM surged above 113 in mid May, pulled back with a correction to the 111 area and continued higher with last week's breakout. Last week's lows mark a support zone in the 111 area. Broken resistance turns first support in the 113 area. The indicator window shows the price relative (IWM:SPY ratio) flattening the last five weeks. A breakout would indicate relative strength in IWM.
http://stockcharts.com/h-sc/ui?s=IWM&p=60&yr=0&mn=2&dy=15&id=p57215118021&a=283139734
**************************************************************
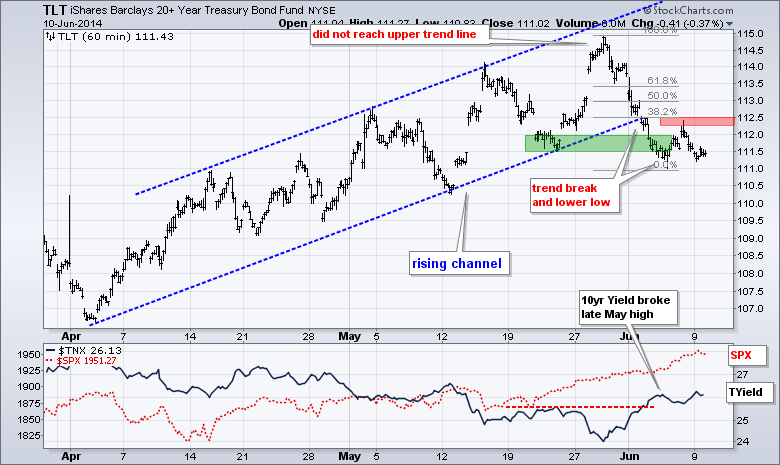
No change. TLT broke the channel trend line and forged a lower low with last week's decline below 111.5. The 10-YR Treasury Yield ($TNX) also broke above its late May highs. It looks like a trend change is afoot in TLT, but the ETF is oversold after a 4% decline (115 to 111.5). This could give way to an oversold bounce that retraces 50-62% with a move back to the 113-113.5 area.
**************************************************************
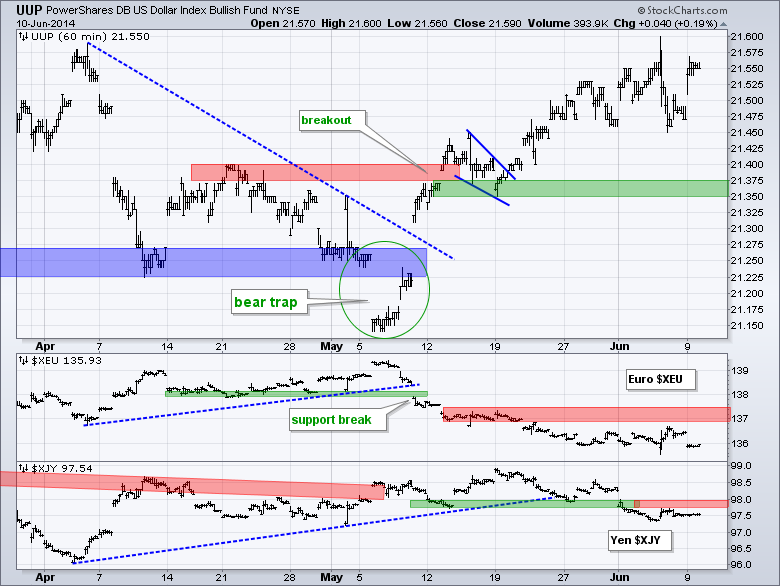
No change. The Euro surged and the Dollar fell after the European Central Bank (ECB) announced its new measures to fight disinflation. I would not call it deflation just yet. The ECB, however, stopped short of a US-style bond buying program (QE). Perhaps the market was expecting QE and did not get it. In any case, this policy change from the ECB was anticipated and we now have a sell-the-rumor and buy-the-news scenario. Traders were short heading into the announcement and covered afterwards. Today's move does not change the overall trajectory for the Dollar. UUP remains in an uptrend with first support in the 21.35-21.375 area. The Euro Index ($XEU) is in a downtrend with resistance at 137.5
**************************************************************
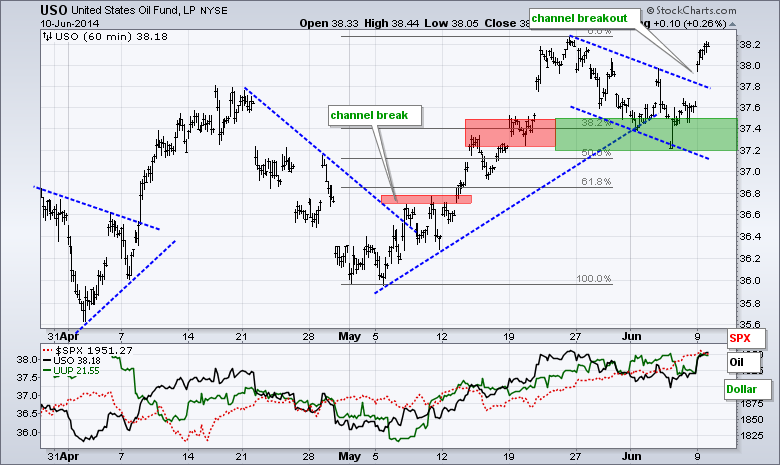
USO ultimately held support in the 37.2-37.4 area and surged above channel resistance to signal a continuation of the bigger uptrend. This more reinforces support at 37.2.
**************************************************************
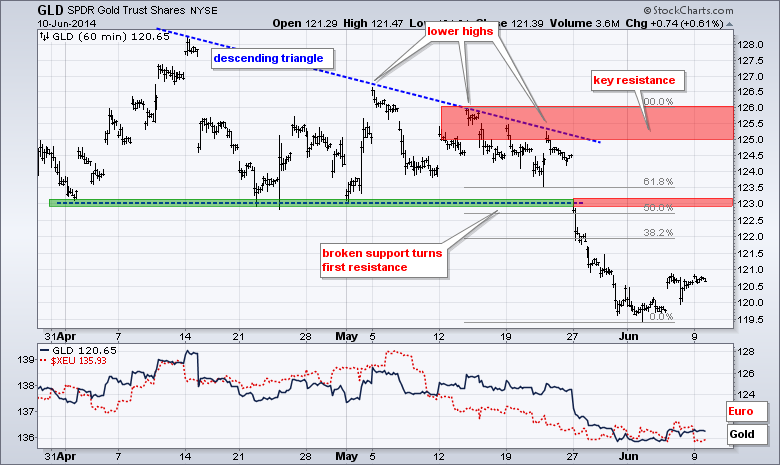
No change. Gold got a small bounce from oversold levels, but the overall trend remains down. This bounce could retrace a portion of the prior decline, which was from 126 to 119.5. Broken support turns first resistance in the 123 area. This area also marks the 50-62% retracement zone. I will leave key resistance in the 125-126 area for now.
***************************************************************
Key Reports and Events (all times Eastern):
Wed - Jun 11 - 07:00 - MBA Mortgage Index
Wed - Jun 11 - 10:30 - Crude Oil Inventories
Thu - Jun 12 - 08:30 - Initial Jobless Claims
Thu - Jun 12 - 08:30 - Retail Sales
Thu - Jun 12 - 10:00 - Business Inventories
Thu - Jun 12 - 10:30 - Natural Gas Inventories
Fri - Jun 13 - 08:30 - Producer Price Index (PPI)
Fri - Jun 13 - 09:55 - Michigan Sentiment
This commentary and charts-of-interest are designed to stimulate thinking. This analysis is not a recommendation to buy, sell, hold or sell short any security (stock ETF or otherwise). We all need to think for ourselves when it comes to trading our own accounts. First, it is the only way to really learn. Second, we are the only ones responsible for our decisions. Think of these charts as food for further analysis. Before making a trade, it is important to have a plan. Plan the trade and trade the plan. Among other things, this includes setting a trigger level, a target area and a stop-loss level. It is also important to plan for three possible price movements: advance, decline or sideways. Have a plan for all three scenarios BEFORE making the trade. Consider possible holding times. And finally, look at overall market conditions and sector/industry performance.


