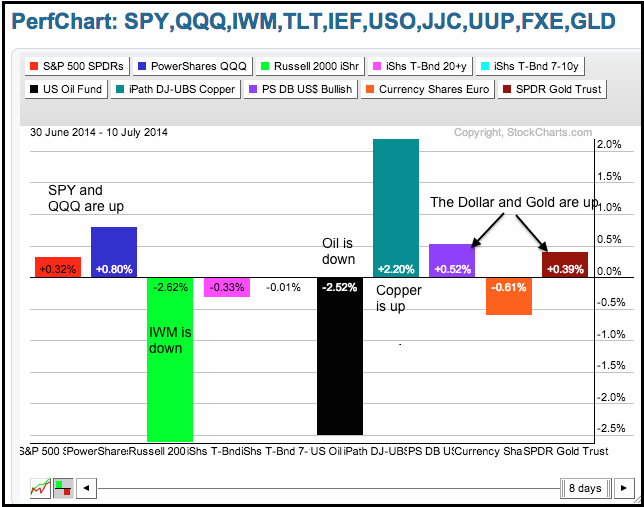
The intermarket PerfChart below shows July getting off to a rather strange start. SPY and QQQ are up slightly this month, but IWM is down sharply with a 2+ percent loss. Relative weakness in small-caps suggests that the equity market may be entering into a corrective period. Small-caps and momentum names fell sharply in March-April, but large-caps held relatively firm and corrected with a sideways consolidation. Perhaps something similar is unfolding again. The USO Oil Fund is down over 2%, but the Copper ETN is up over 2%. Oil lost its Iraq premium as copper caught a bid on an improving economy. The Dollar and gold are both up slightly. The Dollar is benefitting from weakness in the Euro and concern over Portugal. Gold is benefitting from its safe haven status.
**This chart analysis is for educational purposes only, and should not
be construed as a recommendation to buy, sell or sell-short said securities**
*************************************************************
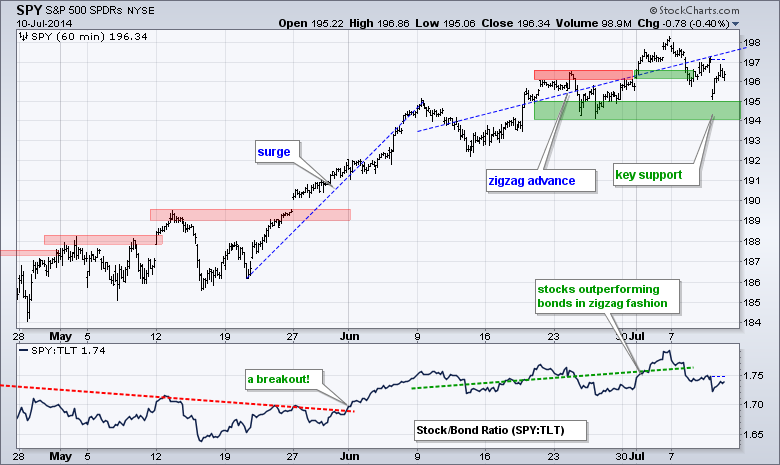
SPY hit a new high near 198 last week and then fell back to the 196 area this week. This week's decline may seem sharp, but it fits within the zigzag pattern we have seen since early June. The short-term trend is up as long as this zigzag continues making higher highs and higher lows. The last zigzag low marks key support at 194.
**************************************************************
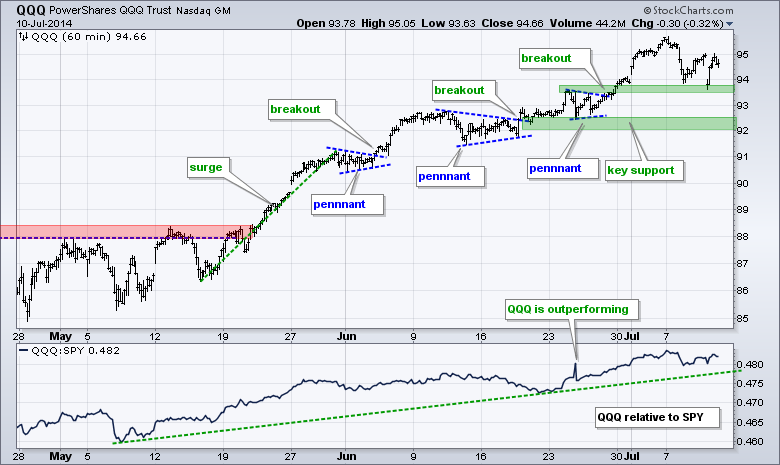
No change. QQQ hit a new high above 95 and then fell towards the first support zone in the 92.5 area. The overall trend remains up as the ETF continues to forge higher highs and higher lows. The last pennant breakout marks first support. The late June lows mark key support. The indicator window shows the QQQ:SPY ratio falling back, but it remains in an uptrend overall and QQQ remains relatively strong.
**************************************************************
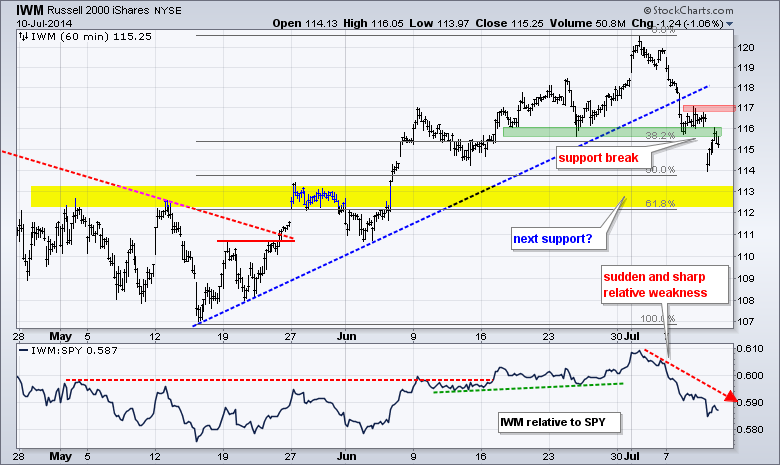
IWM broke support with a sharp decline this week and reversed the short-term uptrend. Broken support and Wednesday's high combine to mark first resistance in the 116-117 area. Broken resistance and the 62% retracement mark the next support zone in the 112-113 area. The price relative (IWM:SPY ratio) fell sharply as IWM significantly underperformed large-caps this month.
**************************************************************
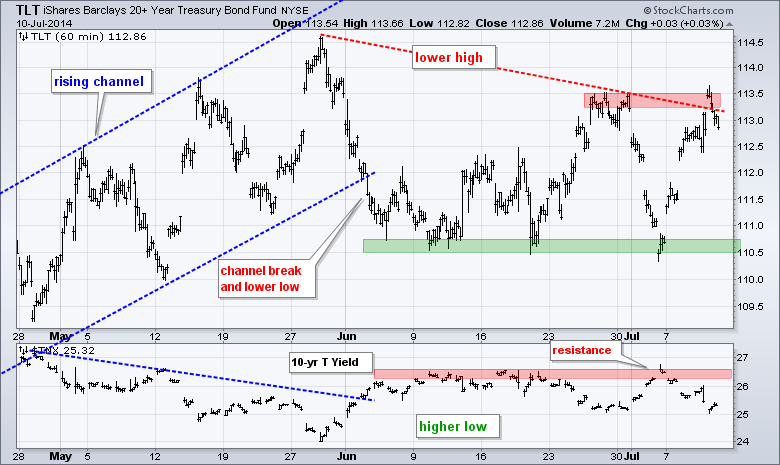
No change. Treasuries caught a big bid as money moved from stocks to relative safety. TLT bounced off the support zone in the 110.5 area for the third time since early June. Technically, the trend since early June is still down because of the lower high in late June. A break above 113.5 would forge a higher high and reverse this downtrend. A breakout in Treasuries would likely occur if we see more selling pressure in stocks.
**************************************************************
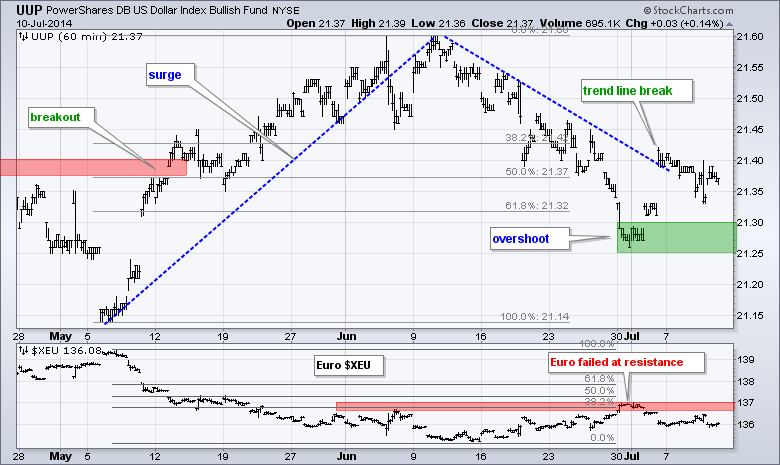
No change. UUP broke the early June trend line with a surge last week and then stalled the last few days. The trend line break is holding, but rising bond prices and lower yields could put downward pressure on the greenback. In particular, I am watching the Euro for a breakout at 137. Such a move would be Dollar bearish and Euro bullish.
**************************************************************
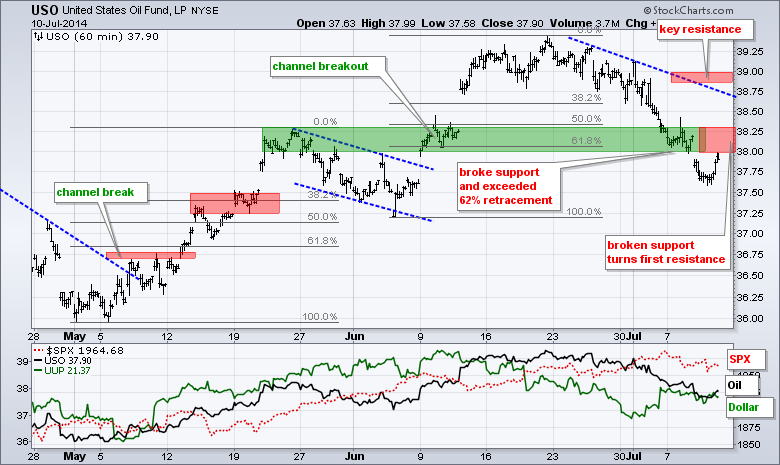
No change. USO broke below support at 38 and exceeded the 62% retracement. Even though the ETF remains above the early June low, this correction has overstayed its welcome and the short-term trend is down. I will leave key resistance at 39 for now.
**************************************************************
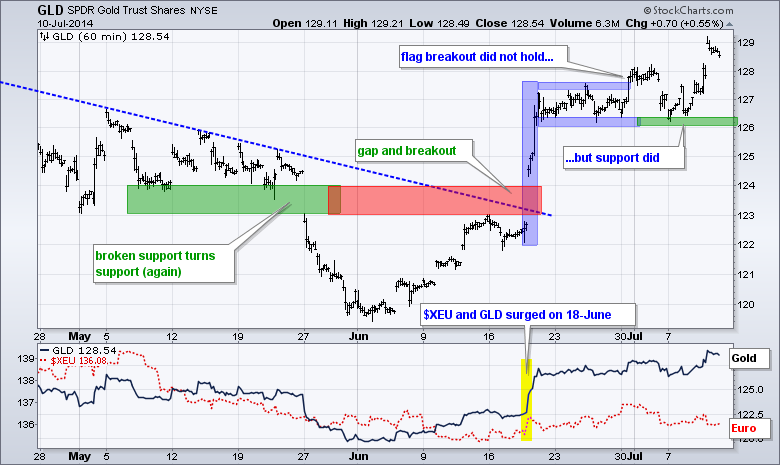
No change. GLD broke flag resistance last week, but did not hold the breakout and fell back to support in the 126 area. GLD got a bounce in afternoon trading on Tuesday and it looks like support is holding. Further weakness in momentum stocks could push money into alternatives and gold might benefit. A move below 126 would break support and suggest that this benefit is not occurring.
***************************************************************
Key Reports and Events (all times Eastern):
Fri - Jul 11 - 10:00 - Happy Friday!
This commentary and charts-of-interest are designed to stimulate thinking. This analysis is not a recommendation to buy, sell, hold or sell short any security (stock ETF or otherwise). We all need to think for ourselves when it comes to trading our own accounts. First, it is the only way to really learn. Second, we are the only ones responsible for our decisions. Think of these charts as food for further analysis. Before making a trade, it is important to have a plan. Plan the trade and trade the plan. Among other things, this includes setting a trigger level, a target area and a stop-loss level. It is also important to plan for three possible price movements: advance, decline or sideways. Have a plan for all three scenarios BEFORE making the trade. Consider possible holding times. And finally, look at overall market conditions and sector/industry performance.


