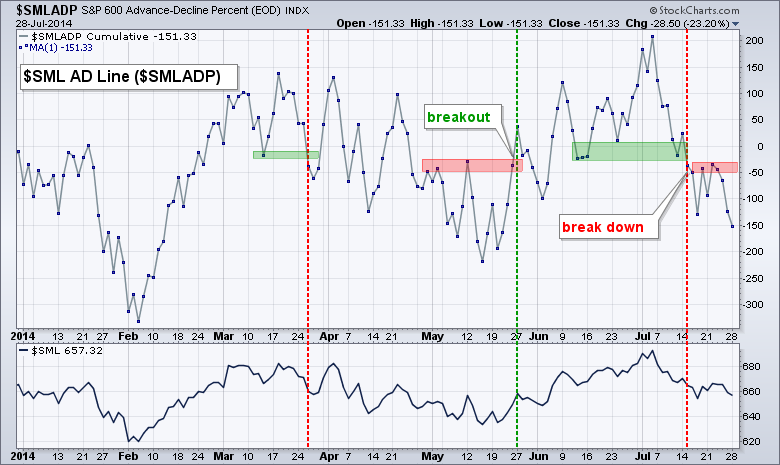
Guess what? Stocks were mixed again on Monday. IWM edged lower and SPY edged higher. And I do mean "edged" because the gains and losses were minimal. Six of the nine sectors were higher with the Utilities SPDR leading (up 1.39%). The Home Construction iShares moved sharply lower again and remains one of the weakest industry group ETFs out there. The Regional Bank SPDR also lost over 1% as the Yield Curve (10YR - 2YR) sank to its lowest level in a year. Gold, silver, steel and coal stocks caught a bid, but energy stocks were lower as oil declined. Overall, the market continues to languish because small-caps are weak. The chart below shows the S&P 600 Small-Cap AD Line ($SMLADP) sinking to a new low for this down swing. The AD Line broke down in mid July and remains in a clear downtrend. A move above last week's high is needed to reverse this downtrend and signal a rebound in small-caps.
**This chart analysis is for educational purposes only, and should not
be construed as a recommendation to buy, sell or sell-short said securities**
*************************************************************
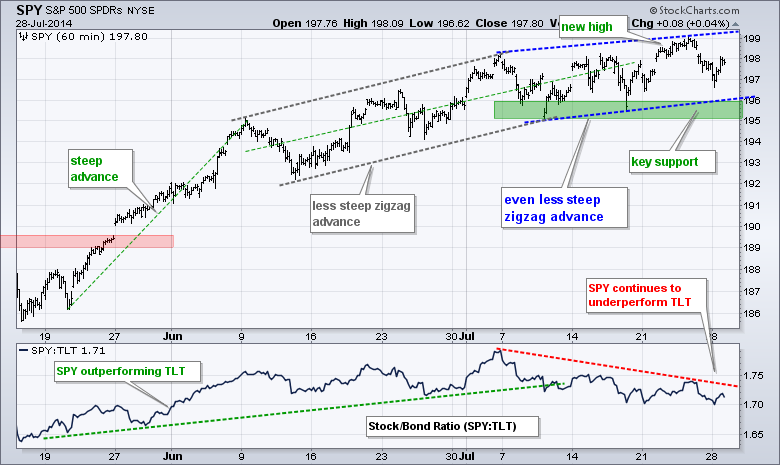
SPY surged from late May to early June and then embarked on two zigzag advances. The angle of the current advance is less steep, but it is an advance nonetheless. Selling pressure remains contained as long as key support at 195-196 holds.
**************************************************************
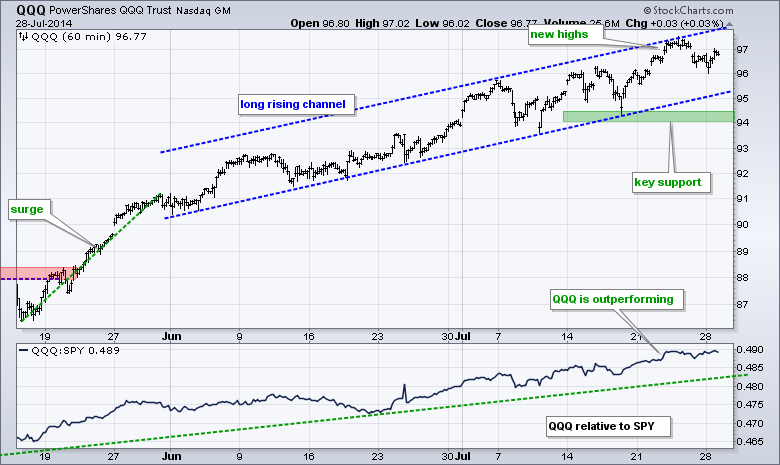
QQQ surged in late May and then moved into a rising channel over the last eight weeks. The ETF retreated from the upper trend line on Friday and could now move towards the lower trend line with a mild correction. The mid July low marks key support in the 94-94.5 area. QQQ continues to outperform SPY.
**************************************************************
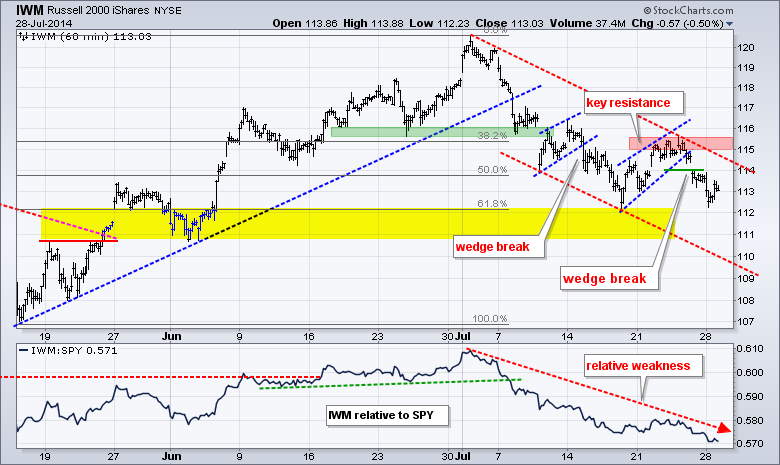
IWM broke wedge support with a sharp decline on Friday to extend its downtrend. Support in the 115-115.5 area has been affirmed, and a break above this zone is needed for a trend reversal. A move to the lower trend line of a developing channel would target a move to the 109-110 area.
**************************************************************
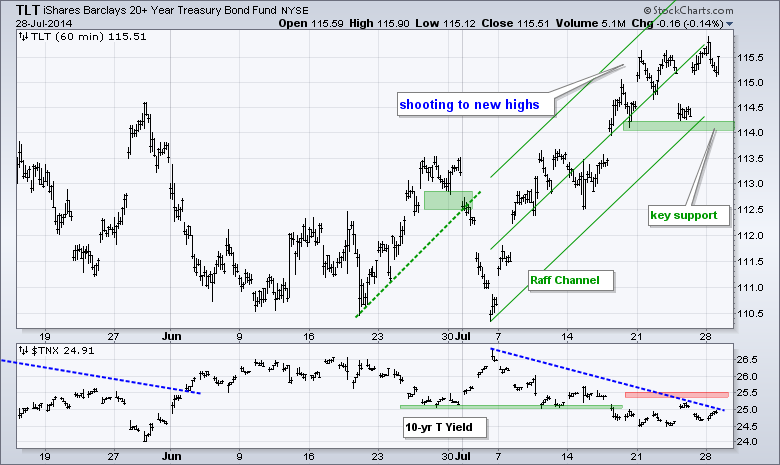
TLT surged off support and closed at it highest level of the month. This affirms support in the 114 area and keeps the uptrend alive. The 10-YR Treasury Yield ($TNX) moved lower and I am marking resistance at 25.5 (2.55%).
**************************************************************
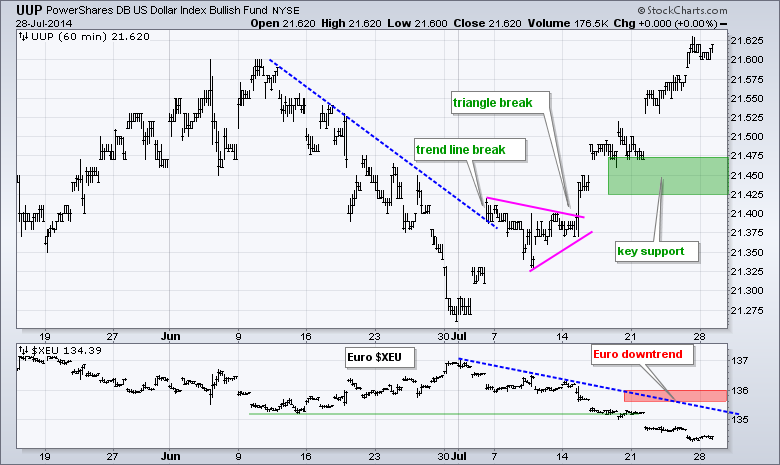
UUP continued higher and exceeded its June high. No weakness here. I will leave key support at 21.425-21.45 for now. The Euro Index ($XEU) continued lower and key resistance is set at 136.
**************************************************************
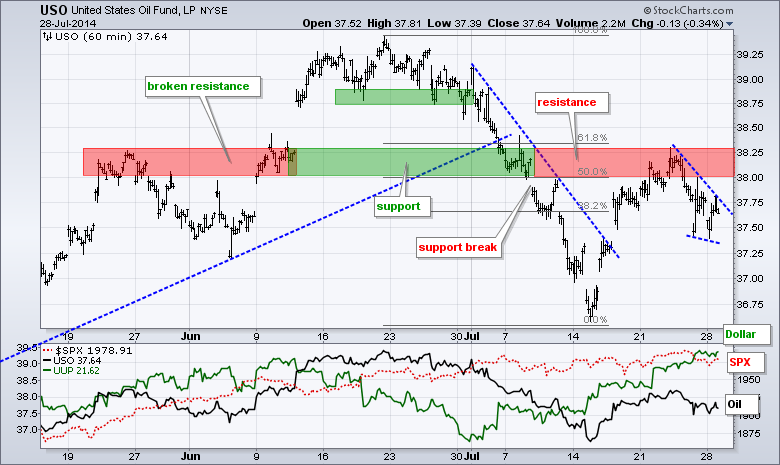
USO surged to the 50-62% and reversed on Thursday. This affirms resistance in the 38-38.25 area. A strong Dollar could weigh on oil, but tension in the Middle East may flare again now that Ramadan is over.
**************************************************************
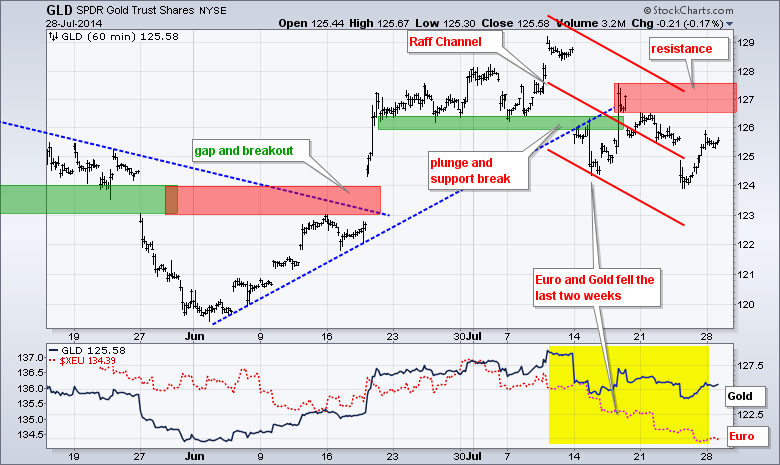
Gold surged on Friday, but this is still a bounce within a downtrend that began with the mid July break down. Admittedly, gold is still a tough call because of recent volatility. The Raff Channel and recent highs mark resistance in the 127 area. A breakout here would reverse the decline and signal a continuation of the June advance.
***************************************************************
Key Reports and Events (all times Eastern):
Tue - Jul 29 - 09:00 - Case-Shiller 20-city Index
Tue - Jul 29 - 10:00 - Consumer Confidence
Wed - Jul 30 - 07:00 - MBA Mortgage Index
Wed - Jul 30 - 08:15 - ADP Employment Report
Wed - Jul 30 - 08:30 - GDP
Wed - Jul 30 - 10:30 - Crude Oil Inventories
Wed - Jul 30 - 14:00 - FOMC Policy Statement
Thu - Jul 31 - 07:30 - Challenger Job Report
Thu - Jul 31 - 08:30 - Initial Jobless Claims
Thu - Jul 31 - 09:45 - Chicago PMI
Thu - Jul 31 - 10:30 - Natural Gas Inventories
Fri - Aug 01 - 08:30 - Employment Report
Fri - Aug 01 - 08:30 - Personal Income & Spending
Fri - Aug 01 - 08:30 - PCE Prices
Fri - Aug 01 - 09:55 - Michigan Sentiment
Fri - Aug 01 - 10:00 - ISM Index
Fri - Aug 01 - 10:00 - Construction Spending
Fri - Aug 01 - 14:00 - Auto/Truck Sales
This commentary and charts-of-interest are designed to stimulate thinking. This analysis is not a recommendation to buy, sell, hold or sell short any security (stock ETF or otherwise). We all need to think for ourselves when it comes to trading our own accounts. First, it is the only way to really learn. Second, we are the only ones responsible for our decisions. Think of these charts as food for further analysis. Before making a trade, it is important to have a plan. Plan the trade and trade the plan. Among other things, this includes setting a trigger level, a target area and a stop-loss level. It is also important to plan for three possible price movements: advance, decline or sideways. Have a plan for all three scenarios BEFORE making the trade. Consider possible holding times. And finally, look at overall market conditions and sector/industry performance.


