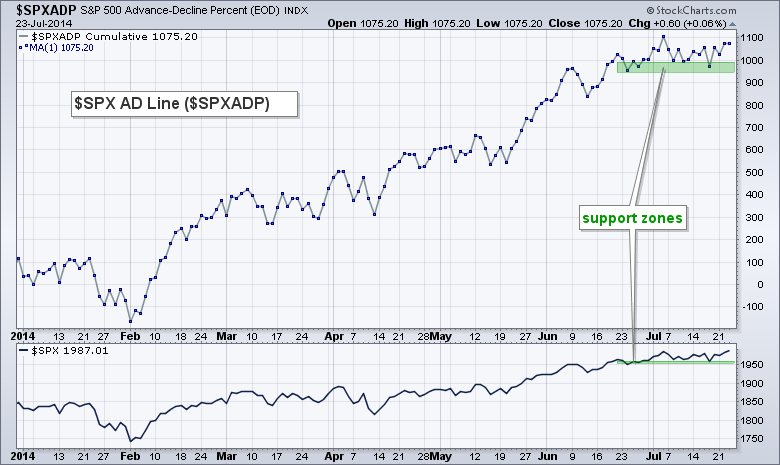
Stocks were mostly higher, but the gains were small and there were some pockets of weakness. QQQ hit a new high and remains the strongest of the major index ETFs. The sectors were mixed with six up and three down. Energy, materials and healthcare led the gainers. The Home Construction iShares moved higher for the second day running and ITB volume was above average. LinkedIn, Yahoo! and Facebook led QQQ higher, but there were pockets of selling pressure in the technology sector as the Networking iShares and Semiconductor SPDR were hit rather hard. The chart below shows the S&P 500 AD Line ($SPXADP) stalling out the last four weeks. The lows extending back to late June mark a support zone to watch for the first signs of a short-term breakdown.
**This chart analysis is for educational purposes only, and should not
be construed as a recommendation to buy, sell or sell-short said securities**
*************************************************************
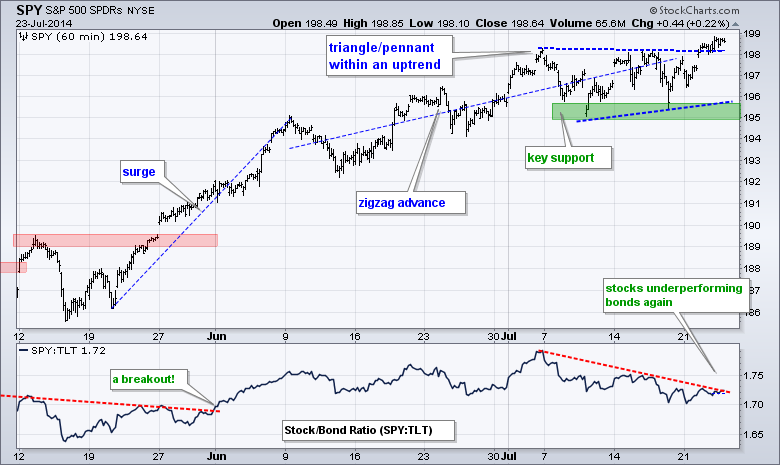
No change. SPY surged from mid May to early June and then zigzagged higher until early July. The ETF moved sideways this month with a triangle/pennant forming. Technically, the trend is up and a consolidation within an uptrend is usually bullish. A break above the upper trend line would signal a continuation higher. The triangle lows mark a support zone in the 195-196 area. The indicator window shows the SPY:TLT ratio moving lower as Treasuries outperform stocks again. This is a negative because it shows a preference for safety.
**************************************************************
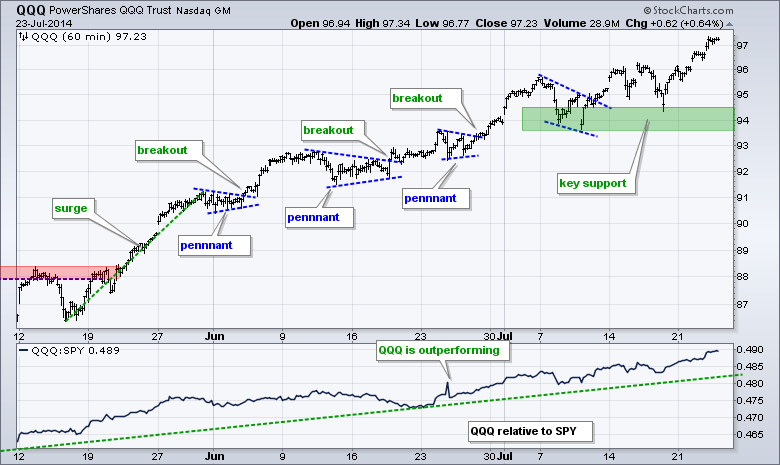
QQQ remains the strongest of the big three major index ETFs. The ETF broke wedge resistance in mid July, pulled back last week and resumed its advance this week. QQQ is up around 3% this month and trading at a new high. The July lows mark a support zone in the 93.5-94.5 area.
**************************************************************
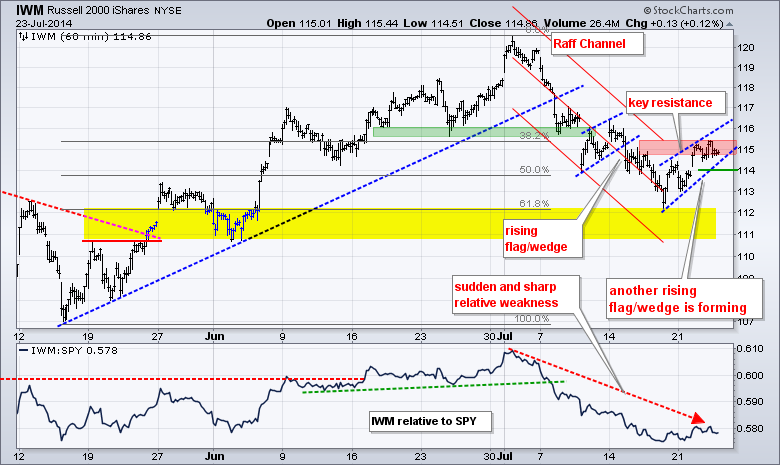
IWM is the weakest of the three major index ETFs followed here. Another rising wedge is taking shape as the ETF hits resistance. A break below 114 would end the rise and signal a continuation of the July downtrend.
**************************************************************
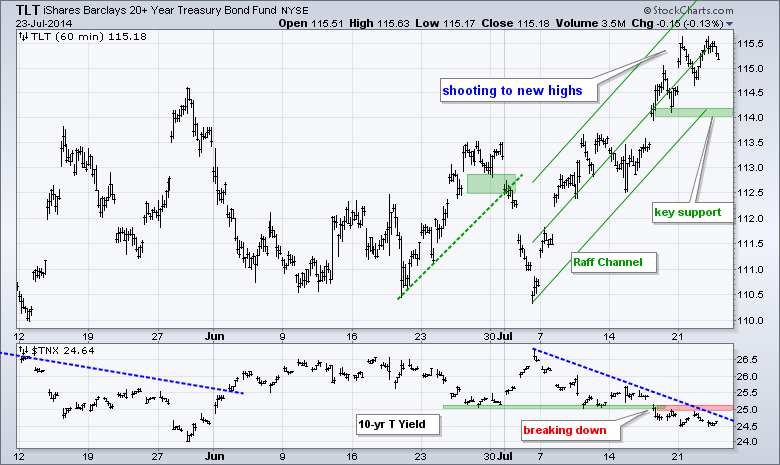
TLT moved above 115.5 in early trading and then fell back. I extended the Raff Regression Channel and am now marking key support at 114. Strength in Treasuries seems to be negative for small-caps, but it does not seem to affect large-caps and big techs.
**************************************************************
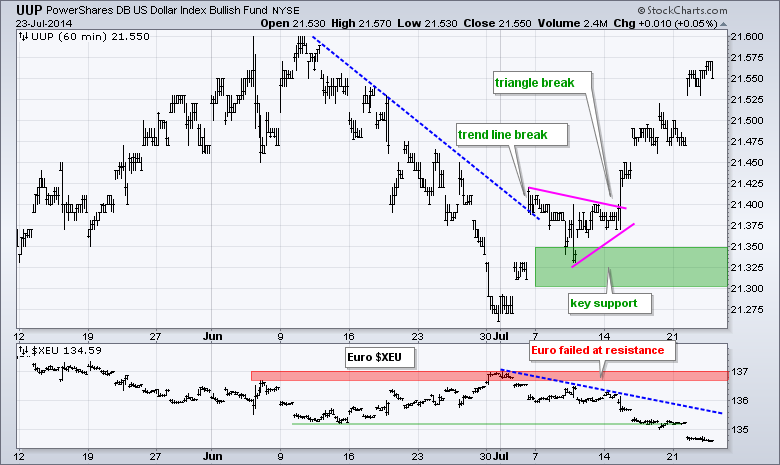
No change. UUP broke the mid June trend line with a surge in early July and then broke triangle resistance last week. The short-term trend is clearly up for the greenback. I am tempted to raise key support, but will hold off for now and leave it in the 21.3-21.35 area. The indicator window shows the Euro Index ($XEU) breaking below its June lows and this is bullish for the Dollar.
**************************************************************
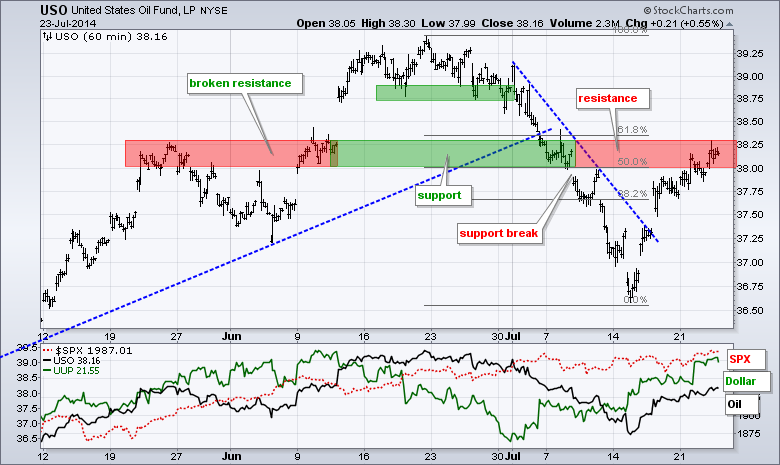
No change: USO broke down in early July and plunged below 37 in mid July. The ETF got a sharp snap-back rally with a surge above 37.50 on Thursday. Turmoil in Ukraine, Gaza and Iraq could be helping the bid in oil. The break above the blue trend line is positive as long as 37.25 holds. I do, however, see potential resistance in the 38-38.25 area from broken support and the 50-62% retracement zone.
**************************************************************
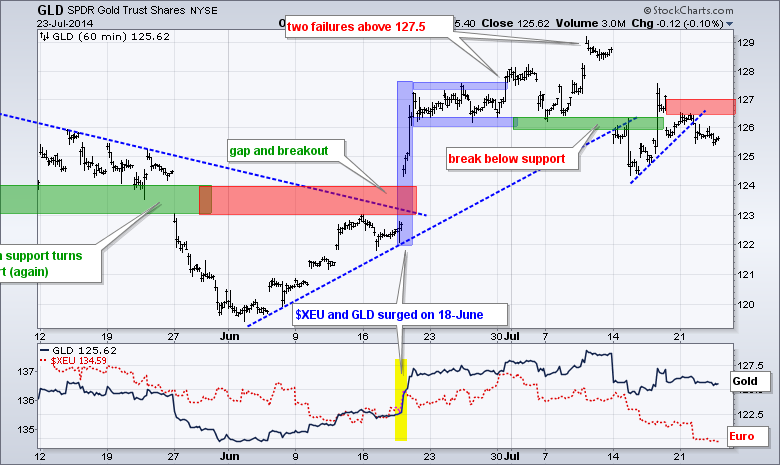
No change. GLD broke support in mid July and then surged above the support break after a commercial airliner was shot down over Ukraine. There was not follow thru to this surge and GLD moved back below 126. The support break appears to be valid right now and I will mark resistance at 127. The bears get the short-term edge as long as this level holds. Dollar strength is also a negative for gold.
***************************************************************
Key Reports and Events (all times Eastern):
Thu - Jul 24 - 08:30 - Initial Claims
Thu - Jul 24 - 10:00 - New Home Sales
Thu - Jul 24 - 10:30 - Natural Gas Inventories
Fri - Jul 25 - 08:30 - Durable Orders
This commentary and charts-of-interest are designed to stimulate thinking. This analysis is not a recommendation to buy, sell, hold or sell short any security (stock ETF or otherwise). We all need to think for ourselves when it comes to trading our own accounts. First, it is the only way to really learn. Second, we are the only ones responsible for our decisions. Think of these charts as food for further analysis. Before making a trade, it is important to have a plan. Plan the trade and trade the plan. Among other things, this includes setting a trigger level, a target area and a stop-loss level. It is also important to plan for three possible price movements: advance, decline or sideways. Have a plan for all three scenarios BEFORE making the trade. Consider possible holding times. And finally, look at overall market conditions and sector/industry performance.


