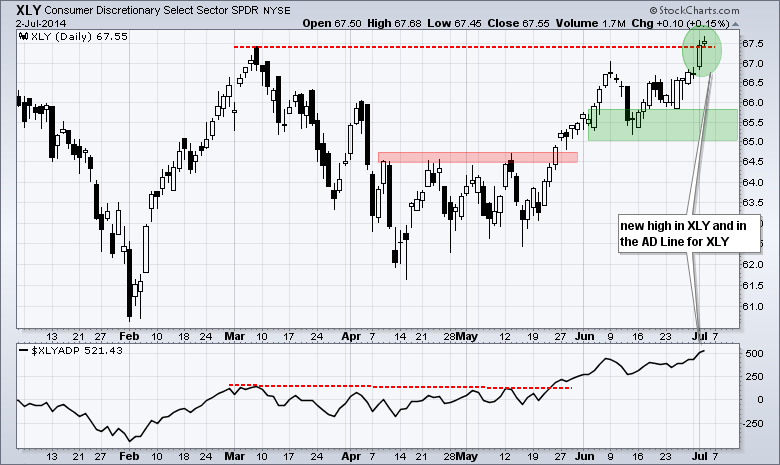
Stocks followed up Tuesday's gains with a mixed trading day on Wednesday. Small-caps and mid-caps came under selling pressure as MDY and IWM fell around .50%. Large-caps held on to their gains as SPY and QQQ finished fractionally higher. Indecisive trading the day before a three day weekend and the employment report is unsurprising. Utilities were not indecisive as the Utilities SPDR (XLU) plunged 2% and is now down around 3% the last two days. Rising Treasury yields are to blame as the 10-YR Treasury Yield ($TNX) surged back above 2.6%. Homebuilders were also hit as the Home Construction iShares (ITB) fell 1%. Rising rates should be positive for financials, but the Regional Bank SPDR (KRE) fell .92% and the finance was down .09%. The healthcare sector seems to be immune to everything as the HealthCare SPDR (XLV) added another .76% and hit a new high. The Consumer Discretionary SPDR (XLY) did not gain much, but the ETF did managed to finally join the other eight sectors with a new high this summer. With the employment report and a three day weekend ahead, I will forgo chart setups for individual stocks. This feature will return on Tuesday. Happy 4th!
**This chart analysis is for educational purposes only, and should not
be construed as a recommendation to buy, sell or sell-short said securities**
**************************************************************
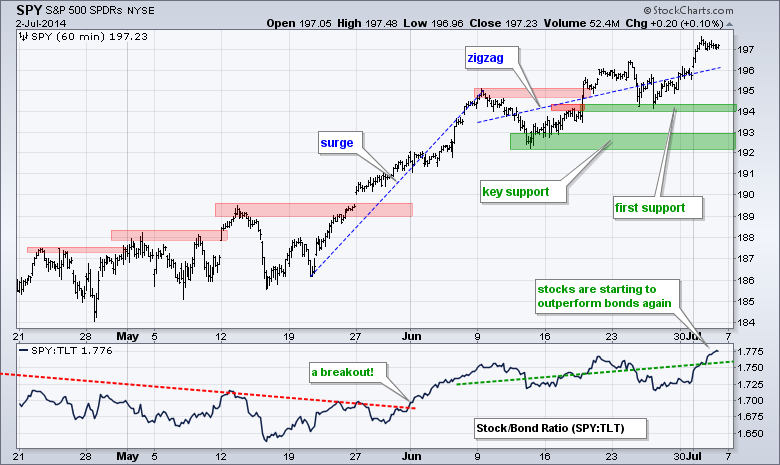
No change. The short-term trend for SPY remains up, but the advance slowed a little as trading turned choppy the last three weeks. Notice how SPY surged from late May to early June. There was a correction the second week of June and the ETF then moved to a new high last week (above 196). The advance may be slowing, but it is still an advance. Last week's lows mark first support in the 194 area. The mid June lows mark key support in the 192-193 area.
**************************************************************
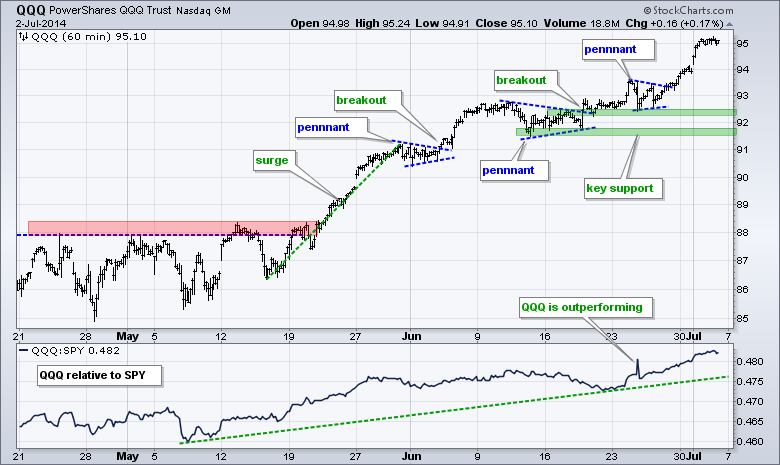
No change. QQQ surged at the end of May and extended its advance in June with a choppier pattern. Three pennants formed and QQQ broke out three times. The most recent breakout occurred on Friday as the ETF finished at a new high. Broken resistance and last week's lows combine to mark first support in the 92.5 area. The mid June lows mark key support in the 91.50 area.
**************************************************************
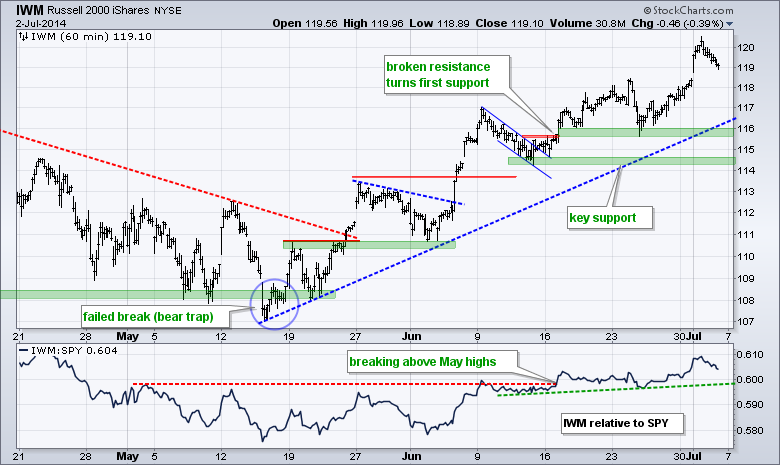
No change. IWM remains in a short-term uptrend and hit a new high near 119 early last week. Even though the ETF reversed after this new high, the flag breakout turned into support and held near 116. This is now the first level to watch for signs of weakness. I will set key support in the 114.5-115 area. A break below this zone would fully reverse the short-term uptrend.
**************************************************************
TLT failed to hold its breakout and plunged to the 111 area. Even though the ETF has yet to break support in the 110.5 area, I think a lower high formed at 113.5 and a downtrend is underway right now. This assumption suggests that support will not hold and TLT will move lower. The 10-YR Treasury Yield ($TNX) moved back above its range break and a break above the June highs would suggest that yields are moving higher.
http://stockcharts.com/h-sc/ui?s=TLT&p=60&yr=0&mn=2&dy=15&id=p50459724090&a=282328660
**************************************************************
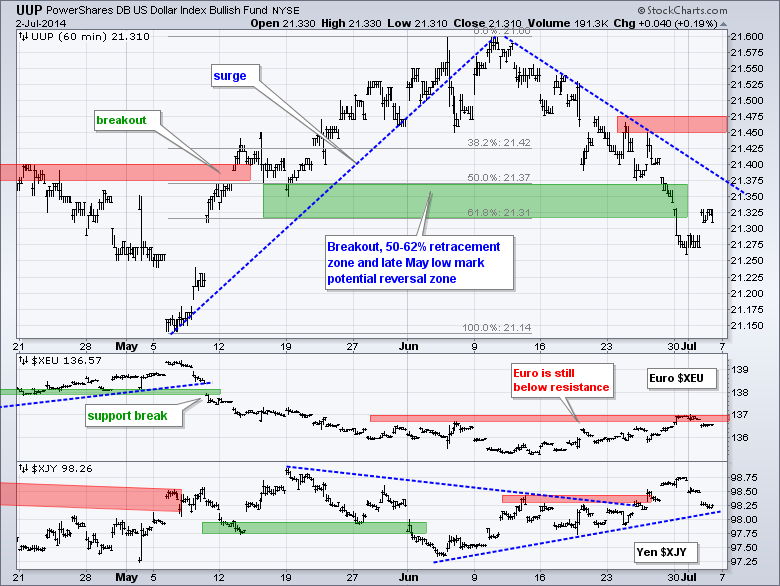
No change. UUP simply fell apart as the Euro surged to resistance and the Yen moved to its highest level of the month (June). UUP did not hold the retracement zone and did not hold the breakout in mid May. Boo hiss. The late June highs mark resistance in the 21.45-21.475 area.
**************************************************************
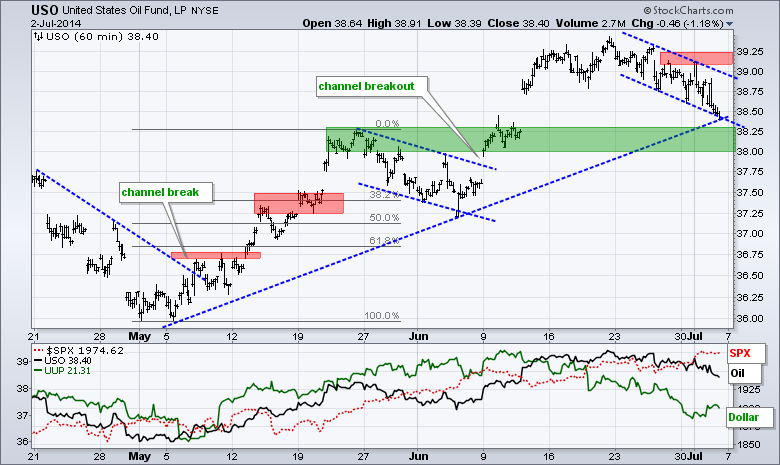
No change. USO surged on the Iraq situation and then fell back over the past week. The decline looks like a falling flag of sorts and a break above 39.25 would signal a continuation of the June surge. The early May trend line and broken resistance mark key support in the 38-38.25 area.
**************************************************************
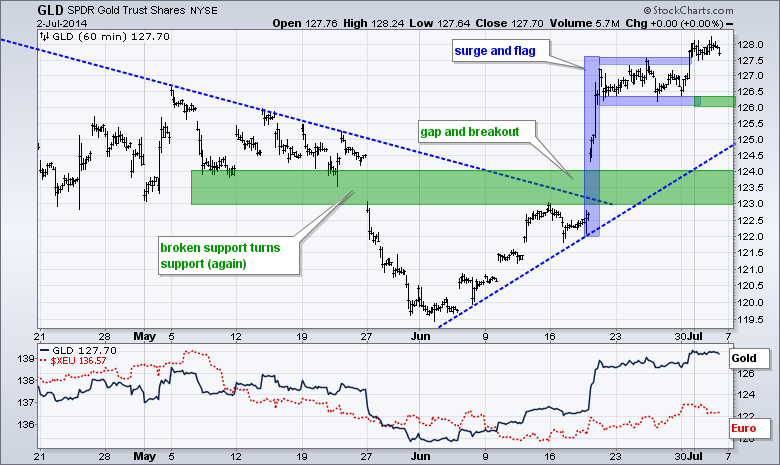
No change. GLD surged and then consolidated with a flat flag. The ETF got a lift from the uncertainty in Iraq and a bounce in the Euro in mid June. Iraq may be turning into a stalemate, but the Euro continued higher and the Dollar plunged over the last few days. GLD broke flag resistance and this signals a continuation of the prior advance. Chartists can mark first support at 126.
***************************************************************
Key Reports and Events (all times Eastern):
Thu - Jul 03 - 08:30 - Employment Report
Thu - Jul 03 - 10:00 - ISM Services Index
Thu - Jul 03 - 10:30 - Natural Gas Inventories
Fri - Jul 04 - 09:00 - Markets Closed, Happy 4th!
This commentary and charts-of-interest are designed to stimulate thinking. This analysis is not a recommendation to buy, sell, hold or sell short any security (stock ETF or otherwise). We all need to think for ourselves when it comes to trading our own accounts. First, it is the only way to really learn. Second, we are the only ones responsible for our decisions. Think of these charts as food for further analysis. Before making a trade, it is important to have a plan. Plan the trade and trade the plan. Among other things, this includes setting a trigger level, a target area and a stop-loss level. It is also important to plan for three possible price movements: advance, decline or sideways. Have a plan for all three scenarios BEFORE making the trade. Consider possible holding times. And finally, look at overall market conditions and sector/industry performance.


