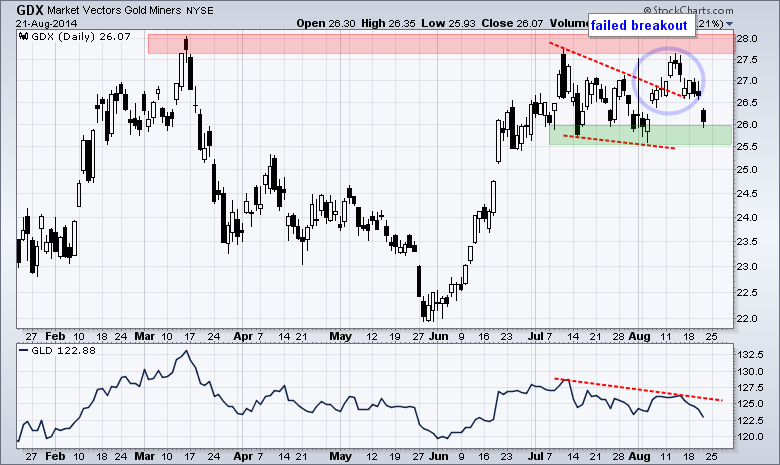
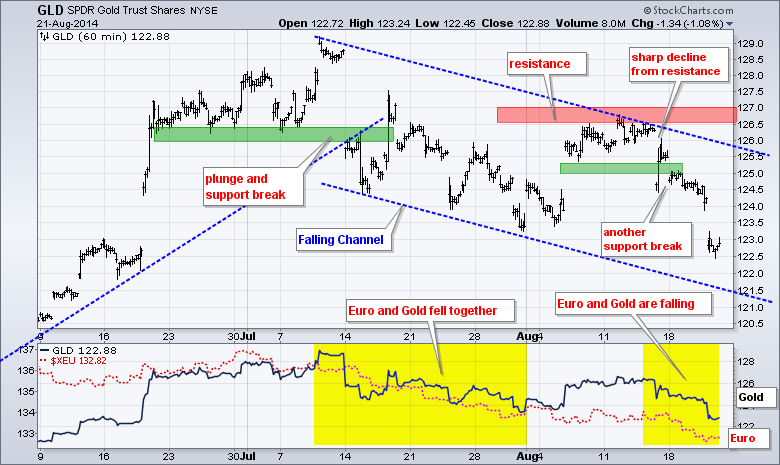
Stocks eked out some gains on Thursday to extend the run that started on August 8th. In particular, the Finance SPDR (XLF) led the way with a 1+ percent gain. Banks and brokers were also higher as the Regional Bank SPDR (KRE) advanced over 1%. Gold returned to its roots and followed the Euro lower. As such the Gold Miners ETF (GDX) fell sharply on Thursday. This is not surprising because gold broke down earlier this week. The chart below shows potential support in the 25.5 area, but I think resistance and the failed breakout are the dominant chart features. I would expect further weakness as long as the Gold SPDR (GLD) holds below 127.
**This chart analysis is for educational purposes only, and should not
be construed as a recommendation to buy, sell or sell-short said securities**
**************************************************************
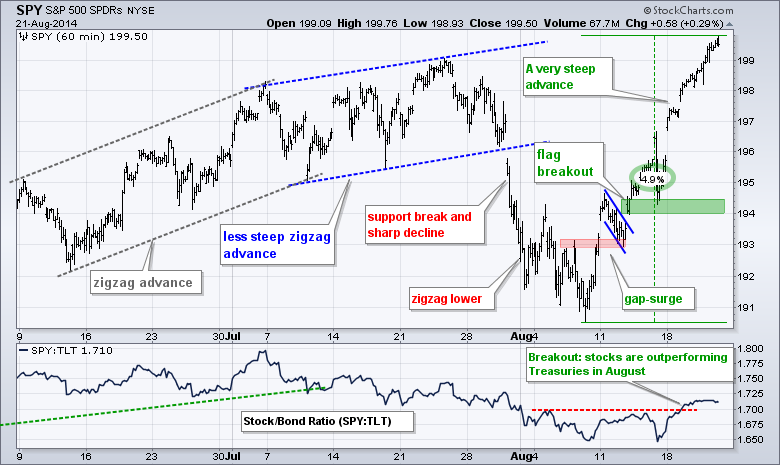
No change. SPY extended its gains even further and is now challenging the late July high. I will leave key support at the 194-194.5 area for now. The SPY:TLT ratio broke above its early and mid August highs this week, which means stocks are outperforming Treasuries this month.
**************************************************************
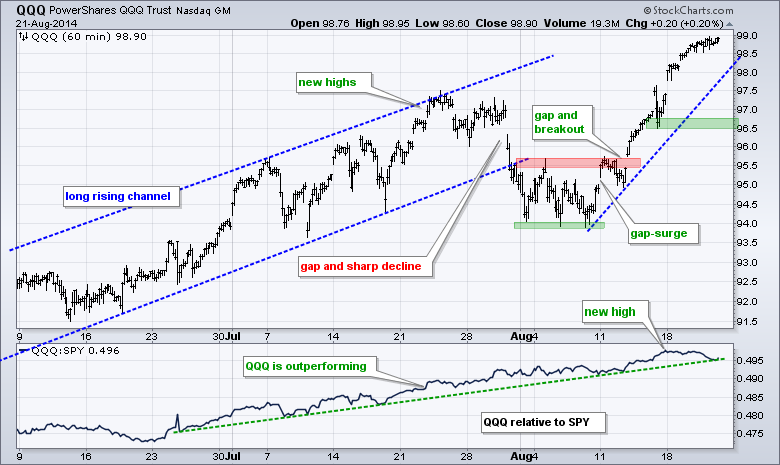
No change. QQQ continues to lead overall with a surge above the July highs. The ETF has now gapped up twice in the last two weeks and held each gap. Friday's low marks first support in the 96.5 area. The indicator window shows the price relative (QQQ:SPY ratio) moving to a new high.
**************************************************************
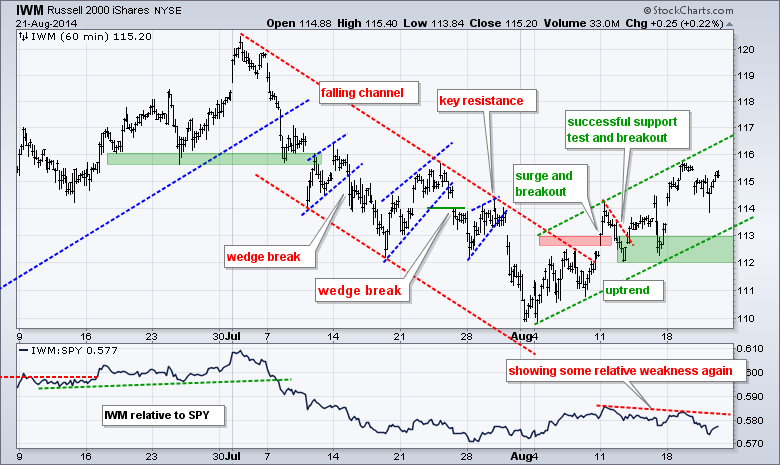
No change. IWM hit the upper trend line of a rising channel and fell back on Wednesday. Small-caps continue to struggle and IWM has started underperforming again. Despite relative weakness and a potential bear flag on the daily chart, the short-term trend is up as long as key support at 112-113 holds.
**************************************************************
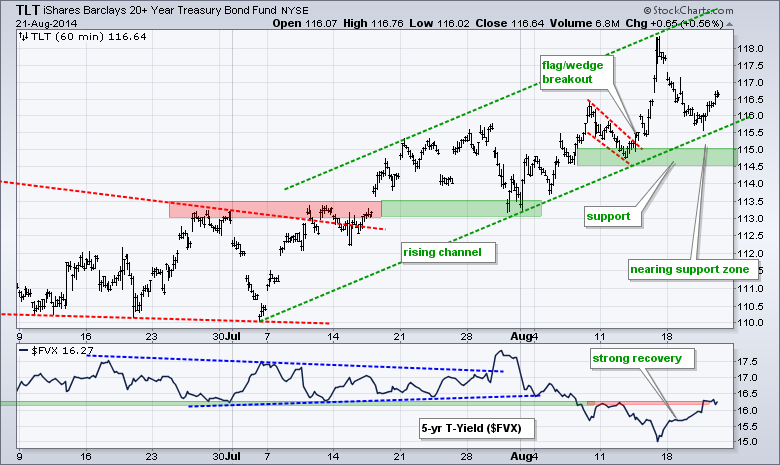
No change. TLT hit the upper trend line of the rising channel and fell back towards the lower trend line over the last few days. The rapid decline suggests that the markets may be turning away from geopolitical concerns and focusing on the US economy. The lower trend line of the rising channel and last week's lows mark key support in the 114.5-115 area. Notice that the 5-year Treasury Yield ($FVX) surged to last week's high in a bid to negate its support break.
**************************************************************
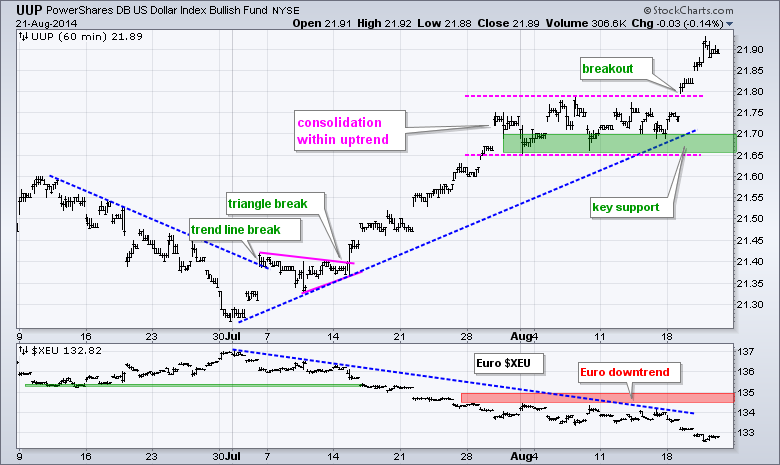
No change. The Euro sank to new lows for the move and the US Dollar ETF (UUP) broke consolidation resistance. This move reinforces support in the 21.65-21.70 area for UUP. I will leave resistance at 135 for the Euro Index ($XEU). It is hard to say if the Dollar is strong or the Euro is weak. The Dollar benefits from a strengthening economy and the potential rise in Treasury yields. The Euro has been hampered by a very sluggish economy, Russian tensions and a dramatic decline in the Bund yield.
**************************************************************
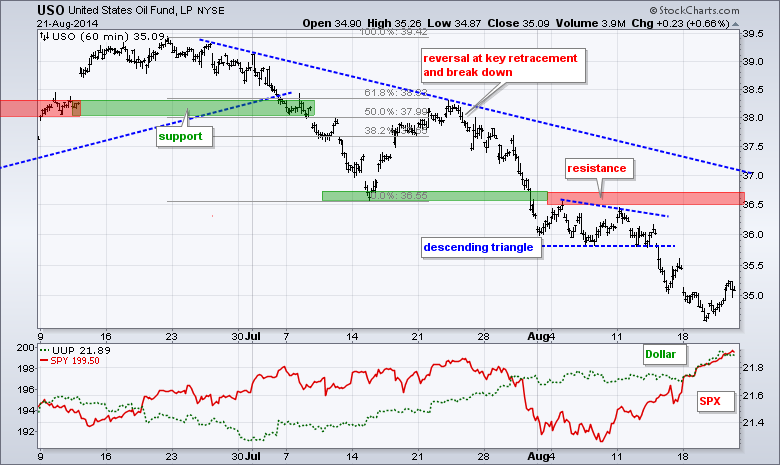
No change. USO broke down in late July, consolidated in early August and continued lower with a sharp decline below 35.50 last week. Ouch. There is simply no bid here. Broken support and the August highs mark key resistance in the 36.5-35.75 area.
**************************************************************
No change. Gold broke below support at 125 for the second time in two days. This decline reinforces resistance in the 126.5-127 area. In addition, this decline keeps the downtrend alive, which has been in force since the mid July break down. A break above 127 is needed to reverse this short-term downtrend. Continued weakness in the Euro is likely to weigh, as could an easing of international tensions.
***************************************************************
Key Reports and Events (all times Eastern):
Fri - Aug 22 - 10:00 - Happy Friday!
This commentary and charts-of-interest are designed to stimulate thinking. This analysis is not a recommendation to buy, sell, hold or sell short any security (stock ETF or otherwise). We all need to think for ourselves when it comes to trading our own accounts. First, it is the only way to really learn. Second, we are the only ones responsible for our decisions. Think of these charts as food for further analysis. Before making a trade, it is important to have a plan. Plan the trade and trade the plan. Among other things, this includes setting a trigger level, a target area and a stop-loss level. It is also important to plan for three possible price movements: advance, decline or sideways. Have a plan for all three scenarios BEFORE making the trade. Consider possible holding times. And finally, look at overall market conditions and sector/industry performance.


