Stocks surge from early Friday to early Monday and then corrected from Monday afternoon to Tuesday. A four day chart reveals a pattern similar to a 1-2 day surge followed by a 1-2 day falling flag. In other words, this week's pullback may just be a mini correction and strength today could trigger flag breakouts on the intraday charts. Keep in mind that small-caps were showing relative strength in early August and IWM led with last week's breakout. Also note that TLT fell back over the last three days and money has moved out of Treasuries.
**This chart analysis is for educational purposes only, and should not
be construed as a recommendation to buy, sell or sell-short said securities**
**************************************************************
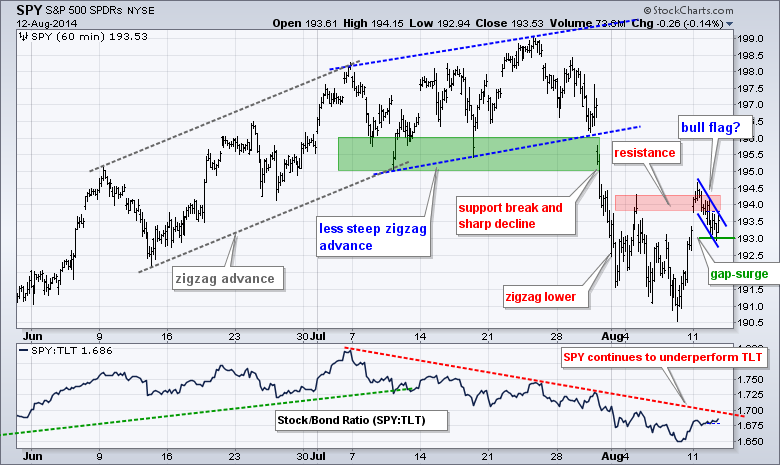
SPY surged to resistance in the 194 area with a gap and then fell back with what looks like a bullish flag. A move above 194 would break flag resistance and signal a continuation higher. A little backing and filling can be expected after a sharp advance, such as the one from 190.5 to 194.5. I would not, however, give this pullback much more room before labeling it a resistance failure.
**************************************************************
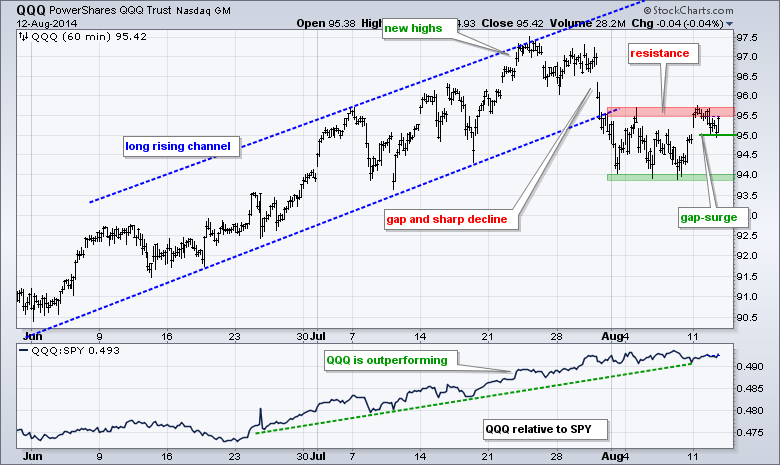
QQQ gapped up, surged to resistance and then fell back to the 95 area. A little pullback after this sharp surge is normal. I would not however, give this pullback too much room because resistance in the 95.5-95.7 area held. A break above 95.7 is needed to complete the reversal. Failure to breakout and a move below 94.8 would be quite negative.
**************************************************************
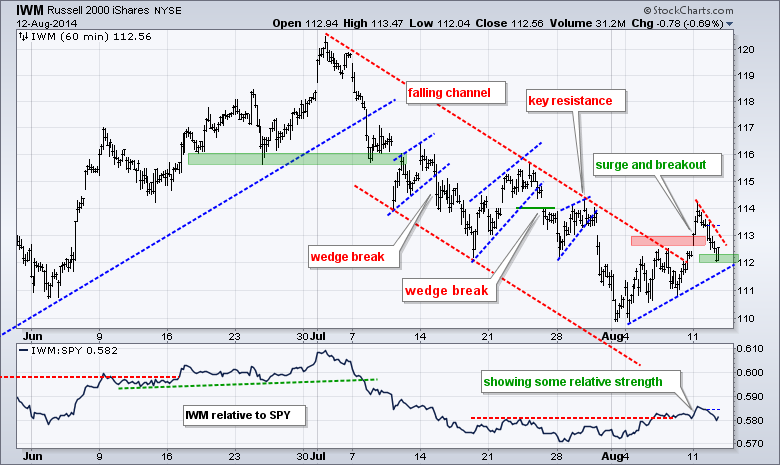
IWM broke out with a surge above 113 and then pulled back to support in the 112 area. A move back above 113 would break the short trend line and signal a continuation of this breakout. Short-term, I am looking to set a level that would suggest this breakout has failed. A move below 111.8 would suggest a failure.
**************************************************************
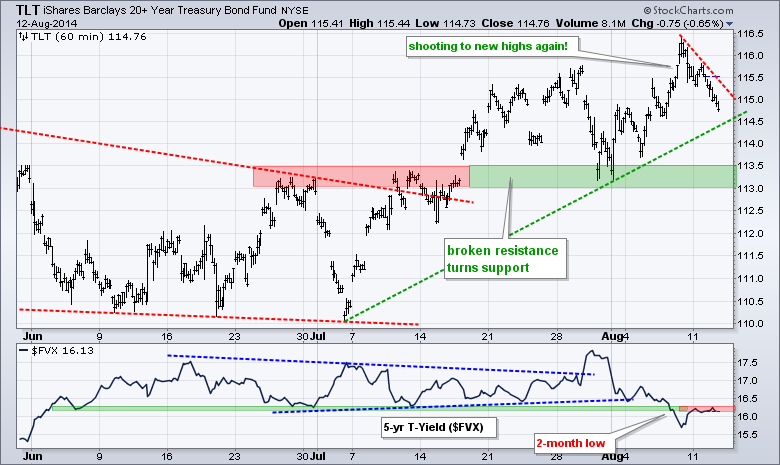
TLT surged to a new high last week and fell back below 115 this week. At this point, it is still considered a correction within a bigger uptrend. A move above 115.5 would end this pullback and signal a continuation higher. I will leave key support in the 113-113.5 area for now. Chartists should also keep an eye on the 5-year Treasury Yield ($FVX) because a breakout at 16.5 (1.65%) would suggest that short-term yields are moving higher.
**************************************************************
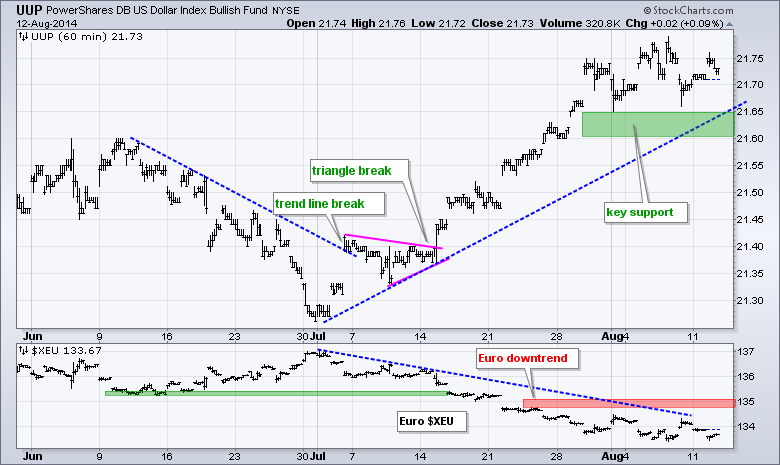
The advance in UUP stalled over the last few days, but the overall up trend remains in place. The Dollar is in an uptrend with support in the 21.6-21.65 area. The Euro is in a downtrend with resistance at 135. I am hesitant to raise support for the UUP, but will remain bullish on the Dollar as long as the Euro holds below key resistance. Dollar strength could be negative for oil and gold.
**************************************************************
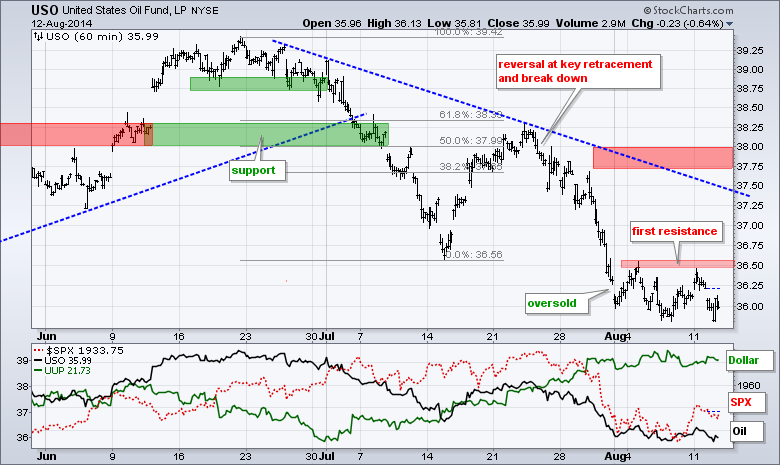
USO broke down in late July and became oversold with the plunge to 36. The ETF did not get much of an oversold bounce and simply consolidated this month. Chartists can watch first resistance at 36.6 for a breakout that would argue for an oversold bounce. I will leave key resistance in the 37.75-38 area for now.
**************************************************************
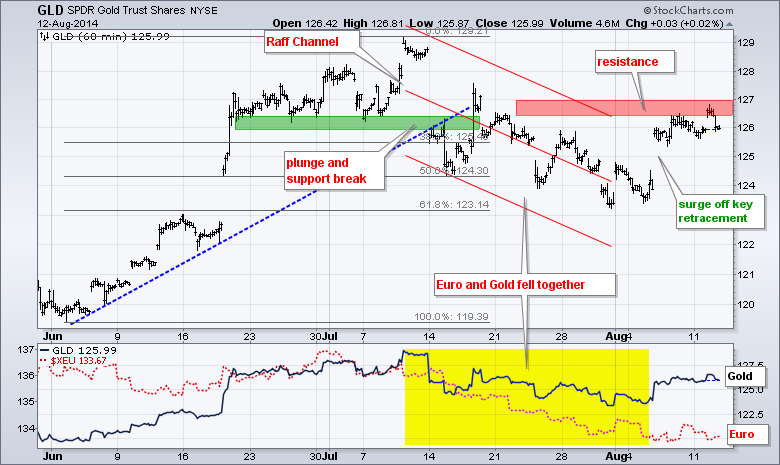
GLD surged above 125 and then stalled near the resistance zone. I am still waiting for a follow through breakout before considering a short-term trend reversal. While this decline may be corrective, it is still a downtrend as long as resistance holds. Furthermore, an uptrend in the Dollar is negative for gold and the Dollar weighs more on gold than geopolitical events. The situations in Iraq, Ukraine, Gaza and elsewhere are not new and are likely to drag on for a long time.
***************************************************************
Key Reports and Events (all times Eastern):
Wed - Aug 13 - 07:00 - MBA Mortgage Index
Wed - Aug 13 - 08:30 - Retail Sales
Wed - Aug 13 - 10:30 - Crude Oil Inventories
Thu - Aug 14 - 08:30 - Initial Claims
Thu - Aug 14 - 10:30 - Natural Gas Inventories
Fri - Aug 15 - 08:30 - Producer Price Index (PPI)
Fri - Aug 15 - 08:30 - Empire State Manufacturing
Fri - Aug 15 - 09:15 - Industrial Production
Fri - Aug 15 - 09:55 - Michigan Sentiment
This commentary and charts-of-interest are designed to stimulate thinking. This analysis is not a recommendation to buy, sell, hold or sell short any security (stock ETF or otherwise). We all need to think for ourselves when it comes to trading our own accounts. First, it is the only way to really learn. Second, we are the only ones responsible for our decisions. Think of these charts as food for further analysis. Before making a trade, it is important to have a plan. Plan the trade and trade the plan. Among other things, this includes setting a trigger level, a target area and a stop-loss level. It is also important to plan for three possible price movements: advance, decline or sideways. Have a plan for all three scenarios BEFORE making the trade. Consider possible holding times. And finally, look at overall market conditions and sector/industry performance.


