And now for the employment report... There is nothing to do but wait for the market's reaction to non-farm payrolls on Friday morning. Given recent data, I would expect non-farm payrolls to meet or exceed expectations. On Thursday, the ISM Services Index hit 59.5, which is very strong. The European Central Bank (ECB) embarked on quantitative easing and this will weigh on the Euro. ADP reports at 204,000 increase in private sector payrolls and this bodes well for non-farm payrolls. There is no change in the charts. I updated the annotations and added a new comment on the Dollar ETF (UUP). Stocks are in uptrends. UUP is trending higher. TLT is testing support. USO and GLD are trending lower.
**This chart analysis is for educational purposes only, and should not
be construed as a recommendation to buy, sell or sell-short said securities**
**************************************************************
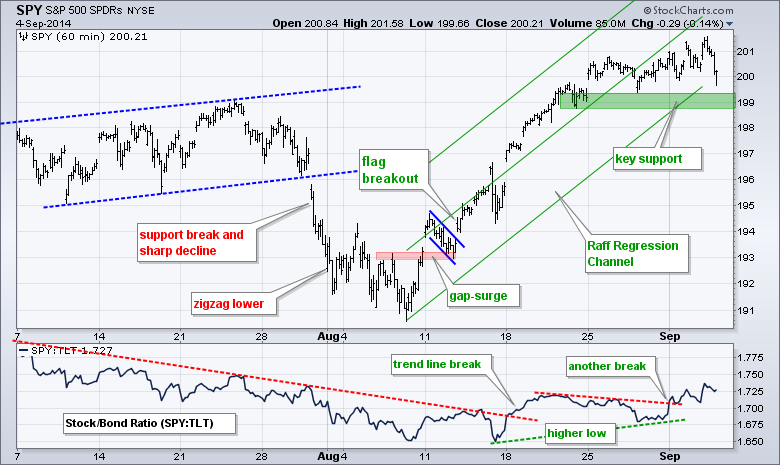
No change. SPY surged over 5% and then consolidated around the 200 level last week. Even though the ETF seems overbought, this is a consolidation within an uptrend and it is bullish. What little selling pressure we saw mid week was answered with another bout of buying pressure. Notice how SPY dipped below 200 and then moved right back above. I am marking key support in the 198.5-199 area.
**************************************************************
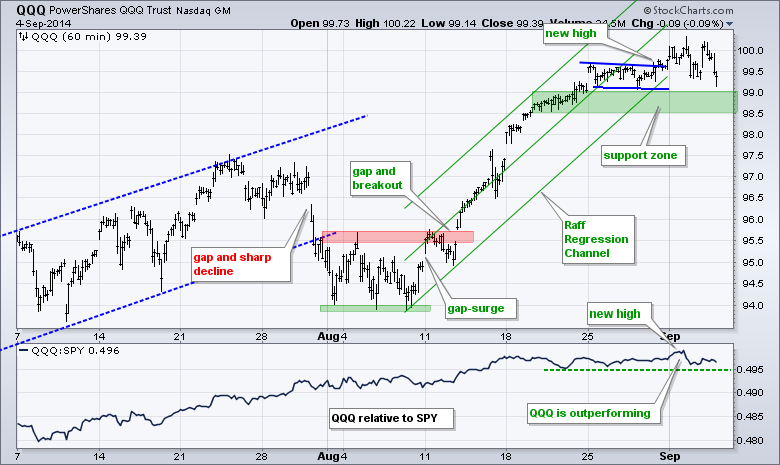
No change. QQQ extended its uptrend and hit another new high on Friday. After surging above 99.5 to start the week, the ETF consolidated with a falling flag of sorts. QQQ broke above the flag trend line on Friday and I am raising key support to the 98.5-99 area. The Raff Regression Channel and mid August consolidation combine to mark support here.
**************************************************************
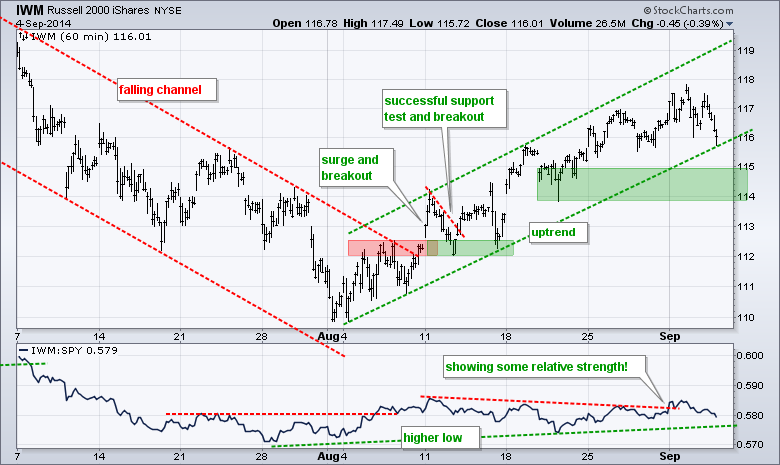
No change. IWM may be underperforming SPY, but it is in an uptrend since early August and by no means weak. This uptrend is steady with a rising channel taking shape the last four weeks. The lower trend line and late August low mark key support in the 113.8-115 area. The price relative (IWM:SPY ratio) continues to edge lower. Watch for a breakout to signal relative strength in small-caps.
**************************************************************
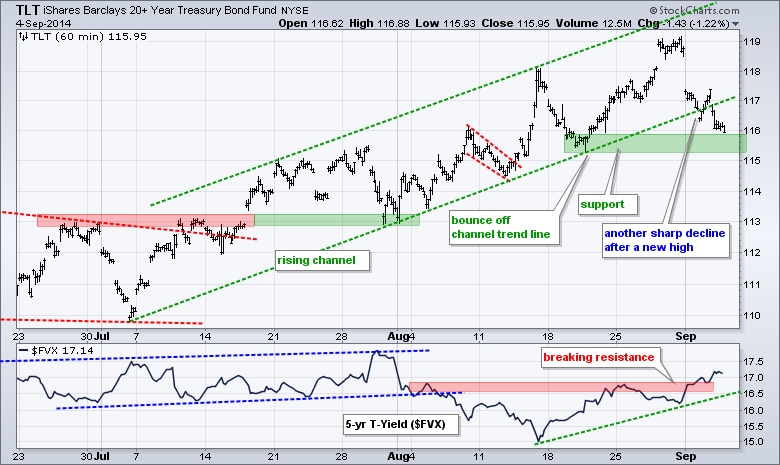
No change. The 20+ YR T-Bond ETF (TLT) hit a new high near 119 last week and promptly fell below 117 on Monday. This decline is certainly sharp and worth noting, but not quite enough to reverse the two month uptrend. Key support remains in the 115.5 area, and a break below this zone would reverse the short-term uptrend. The indicator window shows the 5-year Treasury Yield ($FVX) challenging its August highs.
**************************************************************
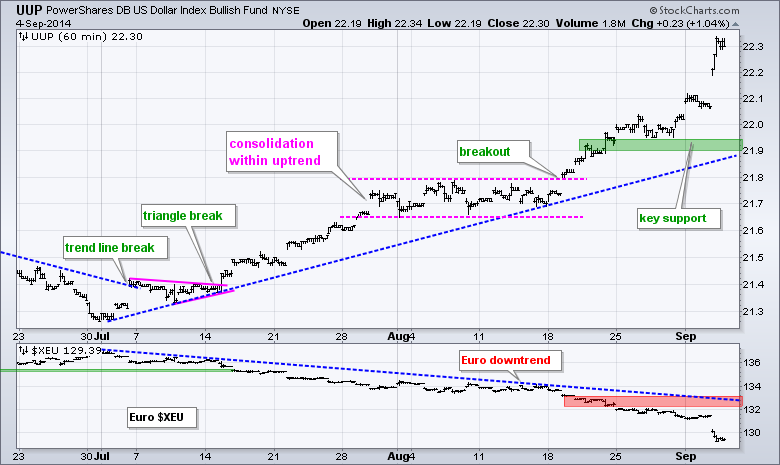
Mark that date. On September 5th, 2014, the European Central Bank (ECB) embarked on quantitative easing. We have seen what happened to the Dollar during QE and it is not the Euro's turn (and the Yen). The US is winding down QE, while the other two are ramping up. The Euro Index ($XEU) plunged over 1% and hit a fresh 52-week low. Key support is set at 21.90.
**************************************************************
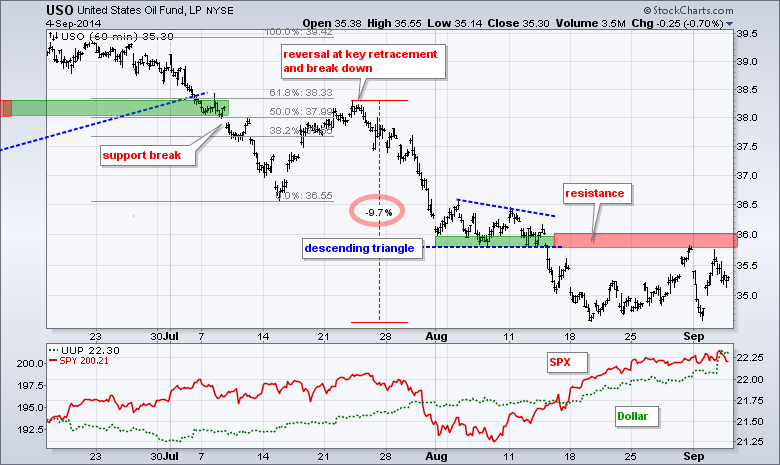
No change. The USO Oil Fund (USO) broke descending triangle support to signal a continuation of the bigger downtrend. Broken support then turned into resistance in the 36 area as the ETF reversed course on Monday. With a reaction high, I will mark key resistance at 36.
**************************************************************
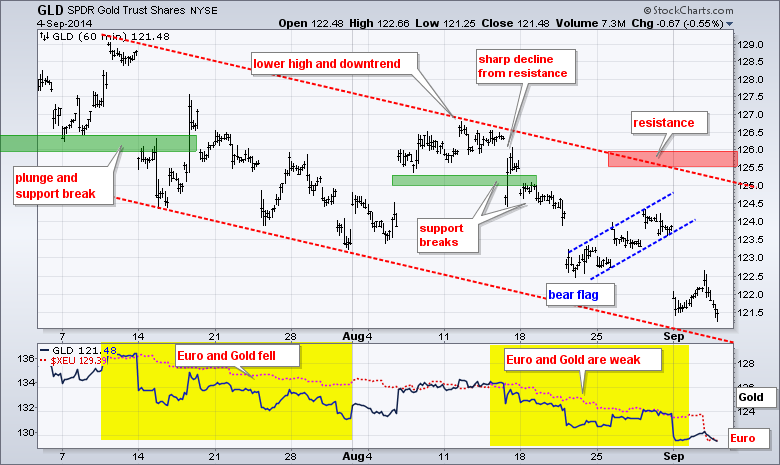
No change. The Gold SPDR (GLD) broke flag support with a big move down. The only positive here is that gold is short-term oversold and near the lower trend line of a falling channel. The upper trend line and a buffer mark key resistance in the 125.5-126 area. A strong Dollar remains a drag on gold and geopolitics are not factoring into the equation.
***************************************************************
Key Reports and Events (all times Eastern):
Tue - Sep 02 - 10:00 - ISM Manufacturing Index (59: very strong)
Tue - Sep 02 - 10:00 - Construction Spending (up 1.8%: very strong)
Wed - Sep 03 - 07:00 - MBA Mortgage Index (up 1.4%)
Wed - Sep 03 - 10:00 - Factory Orders (up 10.5%: very strong)
Wed - Sep 03 - 14:00 - Fed's Beige Book (moderate growth)
Wed - Sep 03 - 14:00 - Auto/Truck Sales (increase to 17.5 annual rate)
Thu - Sep 04 - 07:30 - Challenger Jobs Report
Thu - Sep 04 - 08:15 - ADP Employment Report (+204,000: strong enough)
Thu - Sep 04 - 08:30 - Initial Jobless Claims (299,000: in a downtrend)
Thu - Sep 04 - 10:00 - ISM Services Index (59.6: very strong)
Thu - Sep 04 - 10:30 - Nat Gas Inventories
Thu - Sep 04 - 11:00 - Crude Oil Inventories
Fri - Sep 05 - 08:30 - Employment Report
Chart Setups on Tuesday and Thursday.
This commentary and charts-of-interest are designed to stimulate thinking. This analysis is not a recommendation to buy, sell, hold or sell short any security (stock ETF or otherwise). We all need to think for ourselves when it comes to trading our own accounts. First, it is the only way to really learn. Second, we are the only ones responsible for our decisions. Think of these charts as food for further analysis. Before making a trade, it is important to have a plan. Plan the trade and trade the plan. Among other things, this includes setting a trigger level, a target area and a stop-loss level. It is also important to plan for three possible price movements: advance, decline or sideways. Have a plan for all three scenarios BEFORE making the trade. Consider possible holding times. And finally, look at overall market conditions and sector/industry performance.


