Stocks remain strong. Period. Even though IWM is underperforming SPY, it is trending higher the last four weeks and participating in the broad market advance. Note that QQQ continues to lead with a new high last week. SPY also hit a new high on Tuesday and Friday's close was a closing high. Stocks may seem overbought and ripe for a correction, but trends have energy and selling pressure remains weak. Elsewhere, the Gold SPDR (GLD) formed a small bearish continuation pattern. The Dollar remains strong, while the Yen and Euro remain weak. Oil is getting an oversold bounce within a bigger downtrend. The first week of the month is always big for economic reports and this week is no exception. We have ISM Manufacturing today, Auto-Truck Sales and the Beige Book on Wednesday, ISM Services and Jobless Claims on Thursday and the employment report on Friday. As the chart below shows Initial Jobless Claims remain in a clear downtrend and this is positive for the employment picture, and stock market. The 4-week average is near its lowest level of the year.
**This chart analysis is for educational purposes only, and should not
be construed as a recommendation to buy, sell or sell-short said securities**
**************************************************************
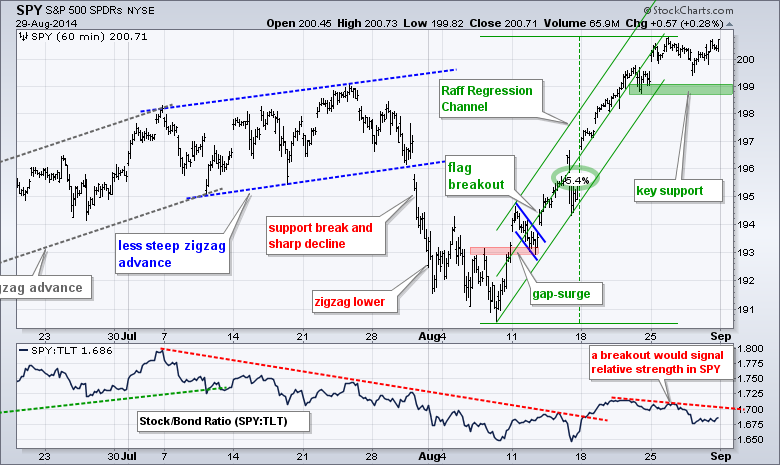
SPY surged over 5% and then consolidated around the 200 level last week. Even though the ETF seems overbought, this is a consolidation within an uptrend and it is bullish. What little selling pressure we saw mid week was answered with another bout of buying pressure. Notice how SPY dipped below 200 and then moved right back above. I am marking key support in the 198.5-199 area.
**************************************************************
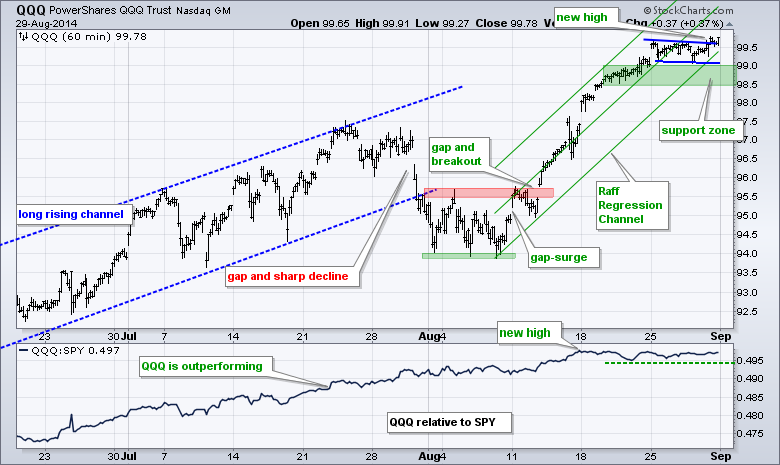
QQQ extended its uptrend and hit another new high on Friday. After surging above 99.5 to start the week, the ETF consolidated with a falling flag of sorts. QQQ broke above the flag trend line on Friday and I am raising key support to the 98.5-99 area. The Raff Regression Channel and mid August consolidation combine to mark support here.
**************************************************************
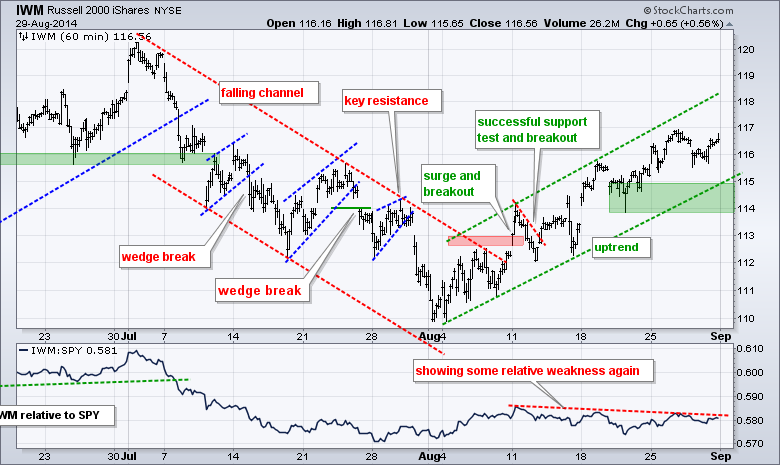
IWM may be underperforming SPY, but it is in an uptrend since early August and by no means weak. This uptrend is steady with a rising channel taking shape the last four weeks. The lower trend line and late August low mark key support in the 113.8-115 area. The price relative (IWM:SPY ratio) continues to edge lower. Watch for a breakout to signal relative strength in small-caps.
**************************************************************
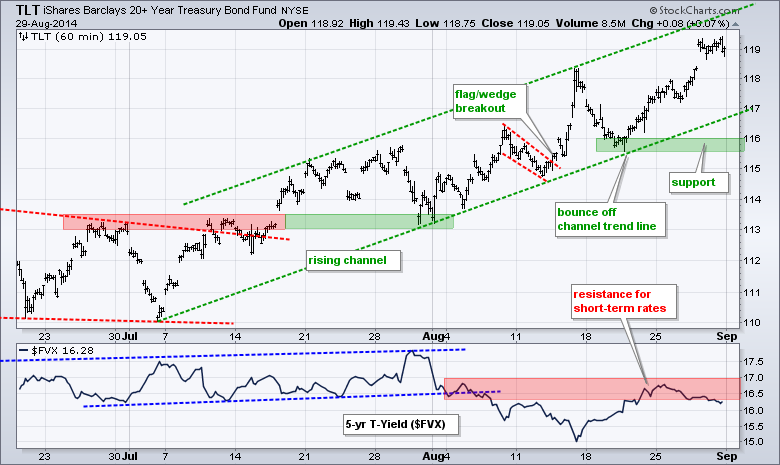
The 20+ YR T-Bond ETF (TLT) extended its uptrend with another new high last week. Once again, TLT is getting overbought and ripe for a pullback, but within a bigger uptrend. The rising channel defines the uptrend and I am marking key support in the 115.5-116 area. The indicator window shows the 5-year Treasury Yield ($FVX) turning down last week. A break above 17 (1.7%) would be bullish for short-term Treasury yields.
**************************************************************
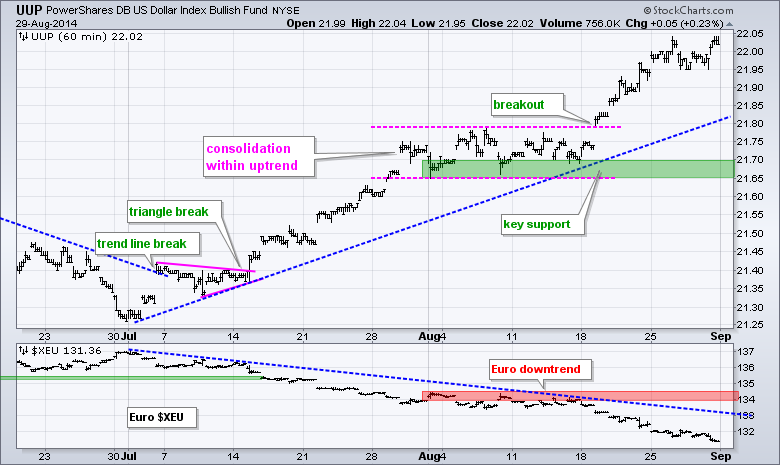
The US Dollar ETF (UUP) broke out near 21.8 in August and moved to a new high for the move last week. Similarly, the Euro Index ($XEU) moved to a new low and remains in a strong downtrend. No change here. UUP support is set at 21.65 and XEU resistance at 134.50. The Yen is also weakening versus the Dollar.
**************************************************************
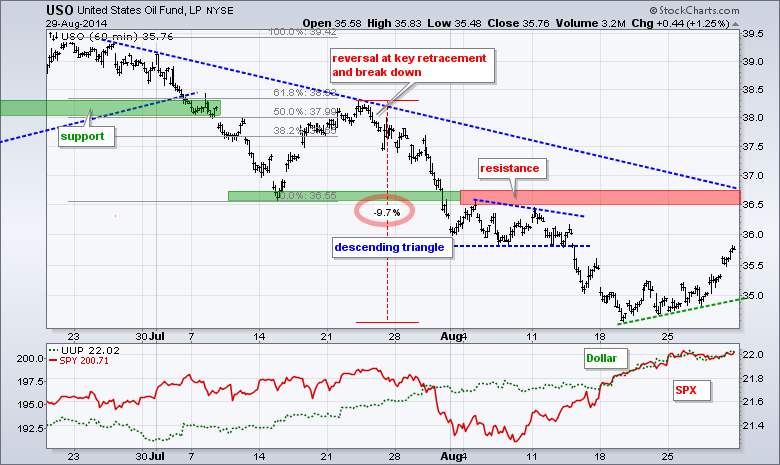
The USO Oil Fund (USO) got an oversold bounce with a move above 35.50 the last few days. The big trend remains down, but this bounce could extend to the 36-36.7 area. I am leaving key resistance at 36.7 for now. Overall, supply issues and a strong Dollar are negative for oil.
**************************************************************
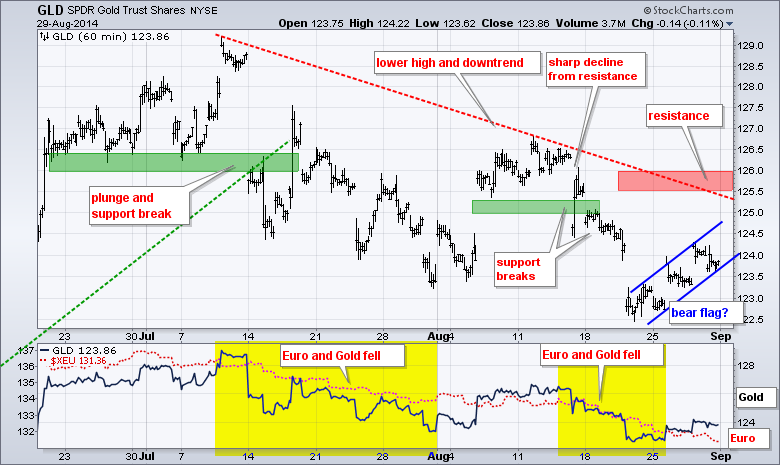
The Gold SPDR (GLD) remains in a downtrend since early July. A lower high formed in mid August and the ETF forged a lower low with the decline below 123. The early July trend line and a buffer mark key resistance in the 125.5-126 area. GLD bounced the last few days, but this looks like a rising flag, which is a bearish continuation pattern. Note that gold is not reacting to geopolitical tensions. A strong Dollar and deflationary pressures may be weighing more.
***************************************************************
Key Reports and Events (all times Eastern):
Tue - Sep 02 - 10:00 - ISM Manufacturing Index
Tue - Sep 02 - 10:00 - Construction Spending
Wed - Sep 03 - 07:00 - MBA Mortgage Index
Wed - Sep 03 - 10:00 - Factory Orders
Wed - Sep 03 - 14:00 - Fed's Beige Book
Wed - Sep 03 - 14:00 - Auto Sales/Truck Sales
Thu - Sep 04 - 07:30 - Challenger Job Report
Thu - Sep 04 - 08:15 - ADP Employment Report
Thu - Sep 04 - 08:30 - Initial Jobless Claims
Thu - Sep 04 - 10:00 - ISM Services Index
Thu - Sep 04 - 10:30 - Nat Gas Inventories
Thu - Sep 04 - 11:00 - Crude Oil Inventories
Fri - Sep 05 - 08:30 - Employment Report
Chart Setups on Tuesday and Thursday.
This commentary and charts-of-interest are designed to stimulate thinking. This analysis is not a recommendation to buy, sell, hold or sell short any security (stock ETF or otherwise). We all need to think for ourselves when it comes to trading our own accounts. First, it is the only way to really learn. Second, we are the only ones responsible for our decisions. Think of these charts as food for further analysis. Before making a trade, it is important to have a plan. Plan the trade and trade the plan. Among other things, this includes setting a trigger level, a target area and a stop-loss level. It is also important to plan for three possible price movements: advance, decline or sideways. Have a plan for all three scenarios BEFORE making the trade. Consider possible holding times. And finally, look at overall market conditions and sector/industry performance.


