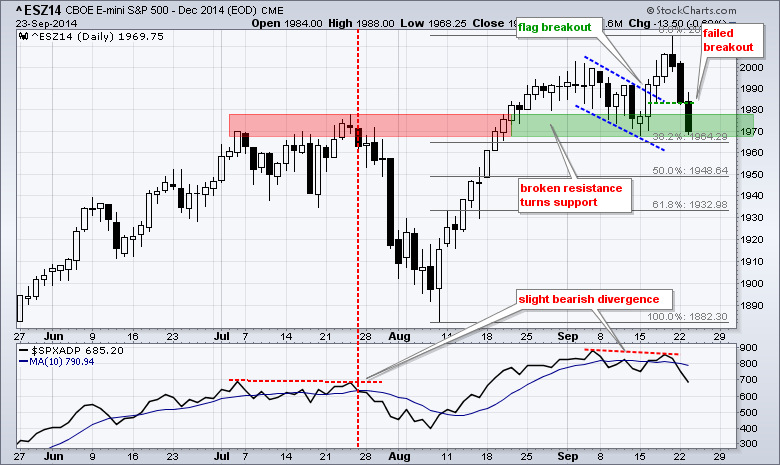
Stocks remained under selling pressure on Tuesday with the major index ETFs recording modest losses. All sectors were down with the consumer staples, consumer discretionary and industrials sectors leading lower. Retailers weighed on the consumer discretionary as the Retail SPDR fell 1%. Gold got an oversold bounce and this lifted the Gold Miners ETF from recent lows. The chart below shows the December E-mini S&P 500 futures contract breaking out last week and failing to hold this flag breakout with a decline to 1070 on Tuesday. The failed breakout is negative, but the emini is near support from broken resistance and the mid September low. The indicator window shows the AD Line for the S&P 500. This indicator formed a very slight bearish divergence and broke below its 10-day SMA. A similar bearish divergence and moving average break preceded the late July decline. Even though the S&P 500 is short-term oversold after a 40 point intraday decline in three days, selling pressure could persists and we could actually see a 50% retracement of the August-September advance. It will be a big day for homebuilders because new home sales will be released at 10AM.
**This chart analysis is for educational purposes only, and should not
be construed as a recommendation to buy, sell or sell-short said securities**
**************************************************************
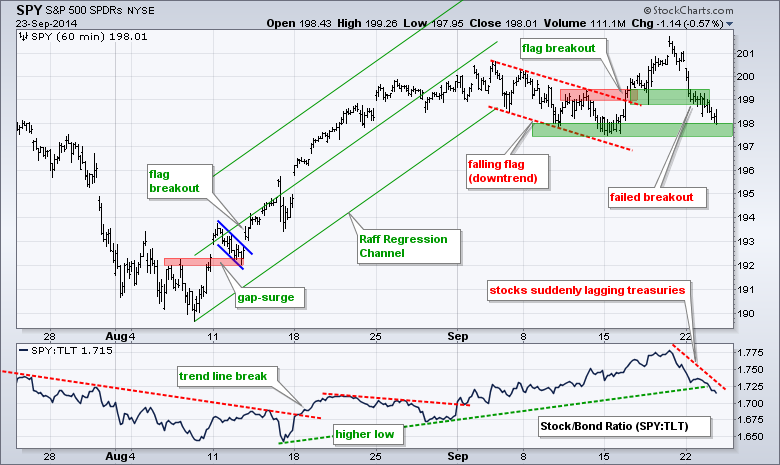
SPY failed to hold its flag breakout and moved below first support. The problem now is that SPY is already near another support level and the bigger trend is up. While chartists can usually find a reason for support if they look hard enough, I think support in the 197.5-198 area is pretty obvious (mid Sept lows). In any case, the failed flag breakout and downtrend in IWM dominate right now and make the short-term trend bearish.
**************************************************************
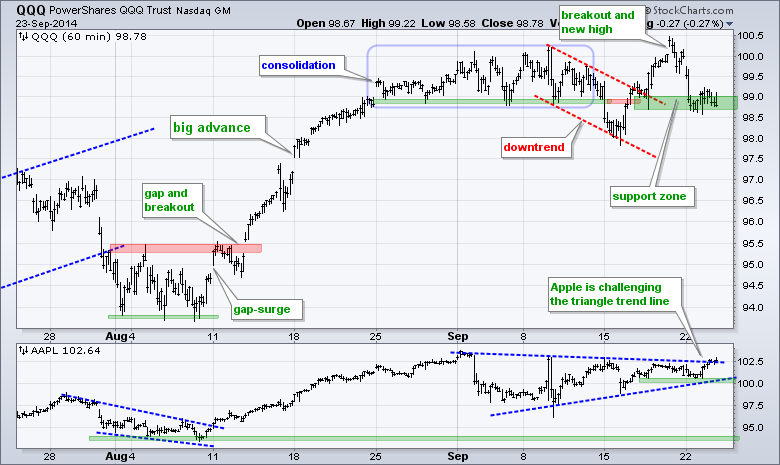
QQQ broke out last week, returned to the breakout area this week and stalled the last two days. A break below 98.5 would signal a continuation lower. As long as QQQ holds support, a break above Tuesday's high could get the rally going again, especially if Apple breaks above the triangle trend line.
**************************************************************
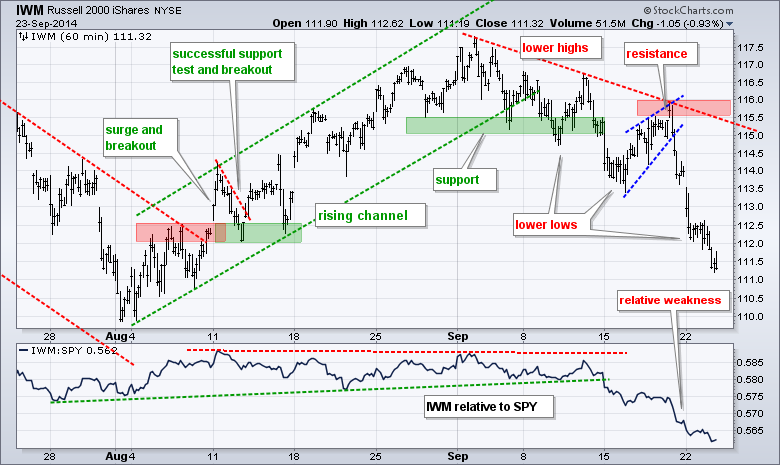
No change. IWM broke support in mid September, formed a lower high last week and plunged over the last two days. Nothing but lower lows and lower highs this month (downtrend). The ETF did managed to firm after the first two hours and is short-term oversold, but the trend is down and the ETF shows relative weakness, which is a negative combination overall.
**************************************************************
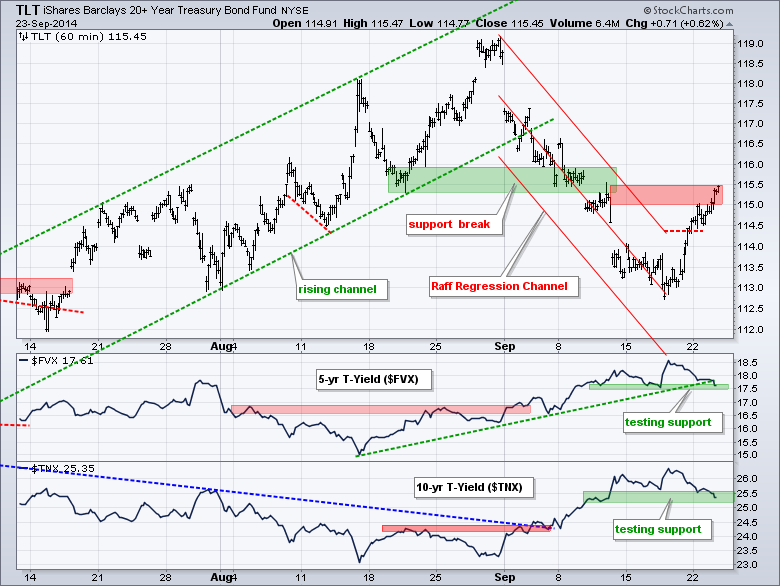
No change. The 20+ YR T-Bond ETF (TLT) got an oversold bounce with a surge above the upper trend line of the Raff Regression Channel. It is tempting to call this a bullish reversal (breakout), but the 10-YR Treasury Yield ($TNX) and the 5-year Treasury Yield ($FVX) remain above support. I would turn bullish on Treasuries if both yields broke support. TLT resistance is set at 115.50 for now. Remember, Treasury yields and prices move in opposite directions and yield analysis is a backstop for price analysis.
**************************************************************
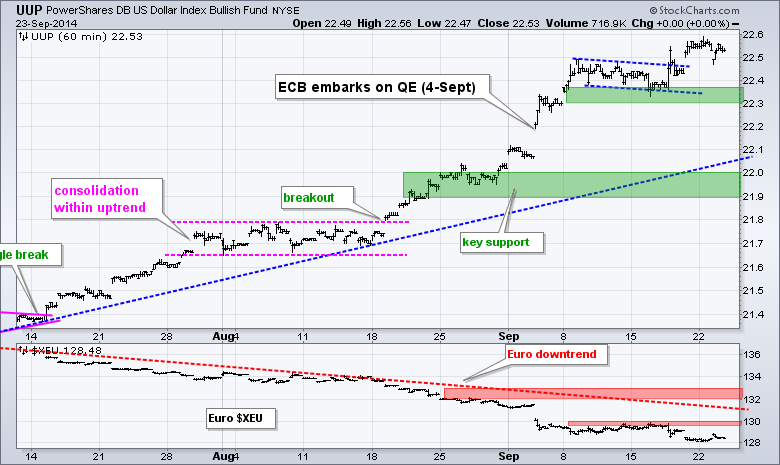
NO change. UUP consolidated in mid September and then broke out (twice). The consolidation lows mark first support in the 22.30-22.40 area. While a move below this level would break support, I would not turn bearish because the bigger trend is still up - and the Euro is in a strong downtrend. Key support for UUP remains at 21.9 for now.
**************************************************************
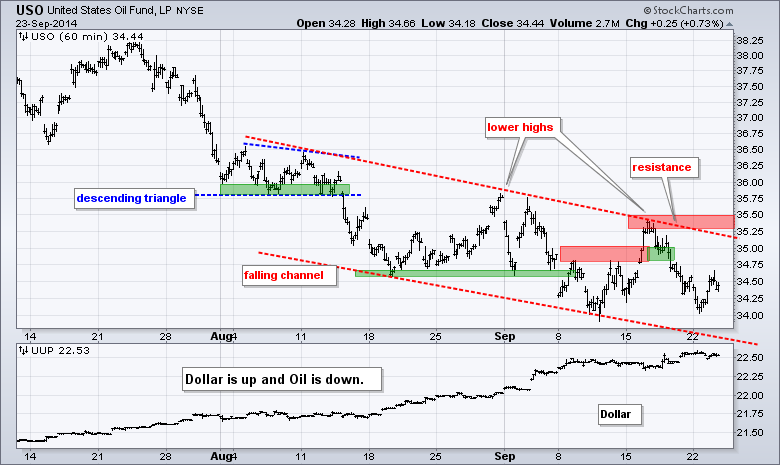
No change. The USO Oil Fund (USO) broke support and then moved right back above this break with a surge on Tuesday. The recovered support break did not last long as the ETF fell back below 34.7 on Thursday. This bounce was considered an oversold bounce within a downtrend. With the reaction high, I can now mark key resistance at 35.5
**************************************************************
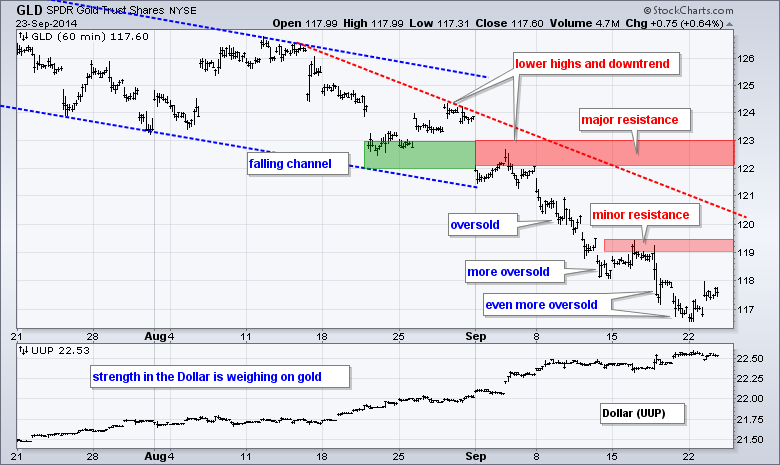
No change. Gold is a classic case of becoming oversold and remaining oversold. With the recent highs around 119-119.5, I will move minor resistance to this area. A breakout here could give way to an oversold bounce. Chartists should also watch the Dollar because gold is clearly tied to the Dollar. Broken support and the early September high mark major resistance in the 122-123 area.
***************************************************************
Key Reports and Events (all times Eastern):
Wed - Sep 24 - 07:00 - MBA Mortgage Index
Wed - Sep 24 - 10:00 - New Home Sales
Wed - Sep 24 - 10:30 - Crude Oil Inventories
Thu - Sep 25 - 08:30 - Initial Jobless Claims
Thu - Sep 25 - 08:30 - Durable Goods Orders
Thu - Sep 25 - 10:30 - Natural Gas Inventories
Fri - Sep 26 - 08:30 - GDP
Fri - Sep 26 - 09:55 - Michigan Sentiment
Chart Setups on Tuesday and Thursday.
This commentary and charts-of-interest are designed to stimulate thinking. This analysis is not a recommendation to buy, sell, hold or sell short any security (stock ETF or otherwise). We all need to think for ourselves when it comes to trading our own accounts. First, it is the only way to really learn. Second, we are the only ones responsible for our decisions. Think of these charts as food for further analysis. Before making a trade, it is important to have a plan. Plan the trade and trade the plan. Among other things, this includes setting a trigger level, a target area and a stop-loss level. It is also important to plan for three possible price movements: advance, decline or sideways. Have a plan for all three scenarios BEFORE making the trade. Consider possible holding times. And finally, look at overall market conditions and sector/industry performance.


