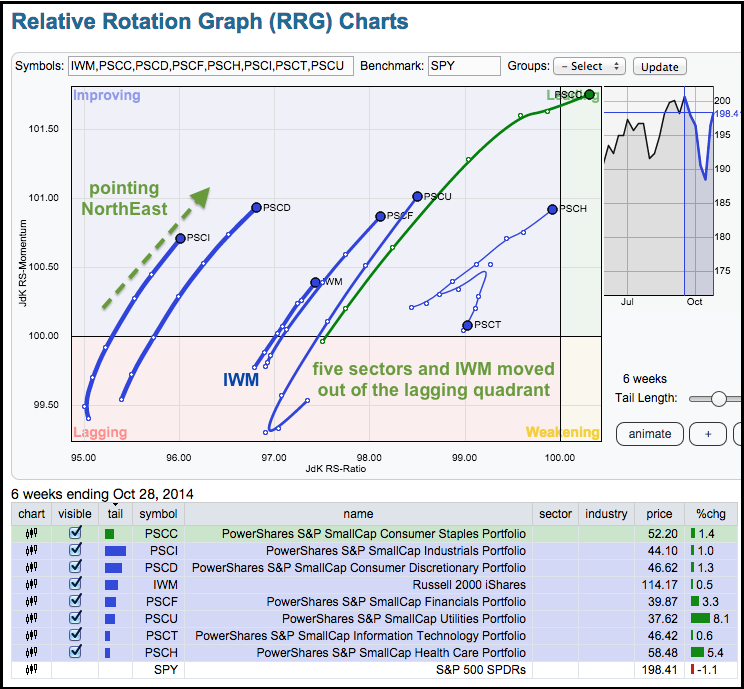
Stocks moved higher again on Tuesday with small-caps and micro-caps leading the charge. The Russell 2000 iShares gained 2.85% and the Russell MicroCap iShares was up over 3%. Keep in mind that it only takes a small rotation to move the needle for small-caps. The S&P 500 has a market cap of around $8.55 trillion. The S&P Small-Cap 600, on the other hand, has a total market cap of around $600 billion, which is a little more than half a trillion Dollars. A relatively small rotation from the S&P 500 to the S&P Small-Cap 600 can have a big affect. The small-cap sectors also performed well as four gained over 2%, two advanced over 3% and two gained over 4%. The SmallCap Utilities ETF (PSCU) was the laggard with a paltry 1.70% gain. The Relative Rotation Graph (RRG) chart below is most interesting because it shows a big improvement in seven of the nine small-cap sectors over the last few weeks. The lines on this chart extend six weeks with each dot representing a week. The SmallCap Energy ETF (PSCE) and SmallCap Materials ETF (PSCM) were left out because they are the big laggards. The S&P 500 SPDR is the benchmark and there are two good takeaways here. First, IWM and seven of the sectors are in the improving quadrant (blue). The SmallCap Consumer Staples ETF (PSCC) is the strongest because it is in the leading quadrant (green). Second, seven of the eight lines are pointing northeast, which means they are moving in the direction that favors relative strength. The SmallCap Technology ETF (PSCT) turned down the last few weeks, but remains in the improving quadrant. In a nutshell, the relative performance for IWM and these seven sectors bodes well for small-caps going forward.
**This chart analysis is for educational purposes only, and should not
be construed as a recommendation to buy, sell or sell-short said securities**
**************************************************************
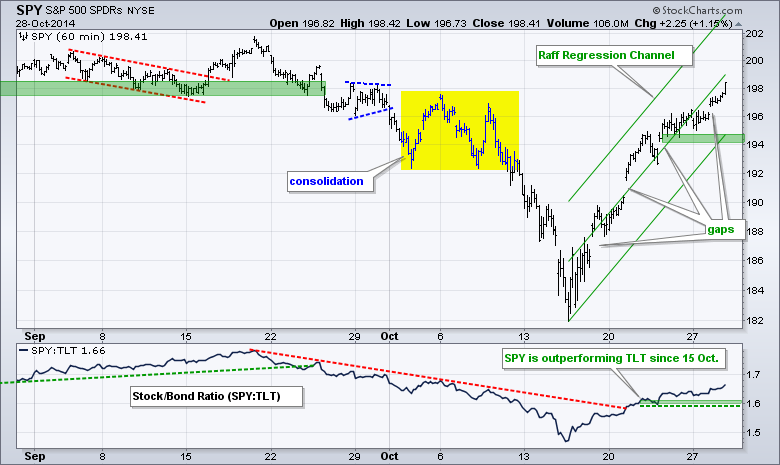
SPY has now gapped up four times in the last three weeks and each gap has held. The latest gap came with the open above 196.5 and the ETF closed above 198. Even though this uptrend may seem extended, the trend trumps and the trend is clearly up. The Raff Regression Channel, Friday-Monday lows and a buffer mark key support at 194. The indicator window shows SPY outperforming TLT since October 15th.
**************************************************************
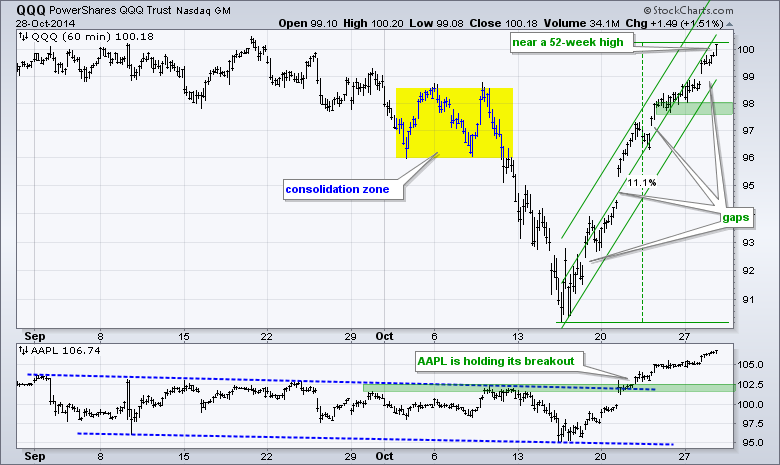
QQQ is up over 10% in three weeks and near a 52-week high. The condition is overbought and resistance is possible near the September highs, but the trend is up and strong. Even though these lines are quite steep, I put on a Raff Regression Channel to define this advance. I will mark key support in the 97.5-98 area.
**************************************************************
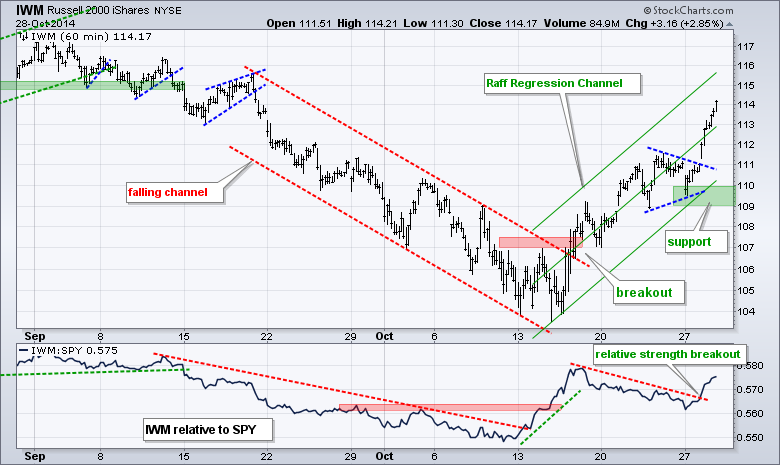
IWM took charge with a gap up and 2.85% surge that blew through the 50-62% retracement zone, which I have since removed. The ETF may seem overbought again, but this overbought condition is secondary to the overall uptrend. The Raff Regression Channel, Monday's low and a buffer mark key support in the 109-110 area. The indicator window shows the IWM:SPY ratio breaking out as small-caps outperform large-caps.
**************************************************************
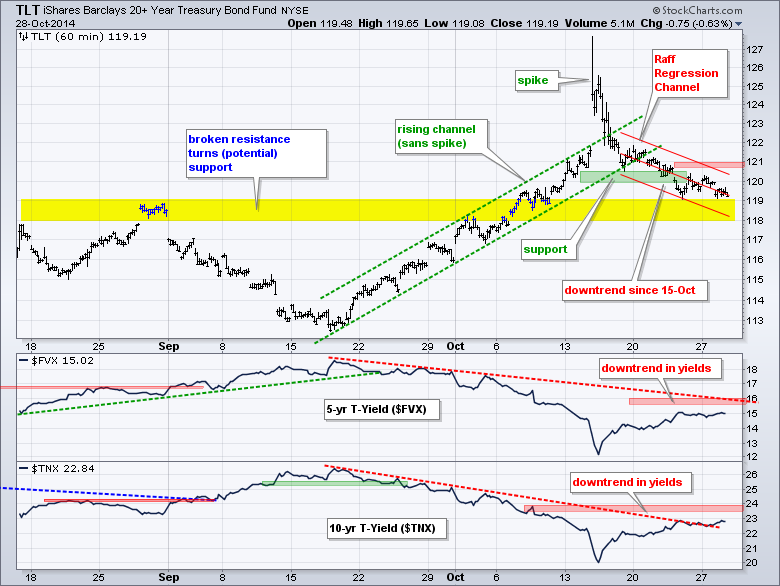
No change. The next two weeks will be big for Treasuries because the FOMC makes it's policy statement on Wednesday, there are a slew of economic reports in early November and the employment report is on Friday, November 7th. On the price chart, I am going to ignore the mid October spike above 127 for now. TLT broke below the lower trend line of the rising channel and moved into a downtrend last week. The red Raff Regression Channel defines this downtrend with resistance at 121. I am watching the 5-year Treasury Yield ($FVX) and 10-YR Treasury Yield ($TNX) closely as well. Resistance breaks in both would be negative for Treasury bond prices.
**************************************************************
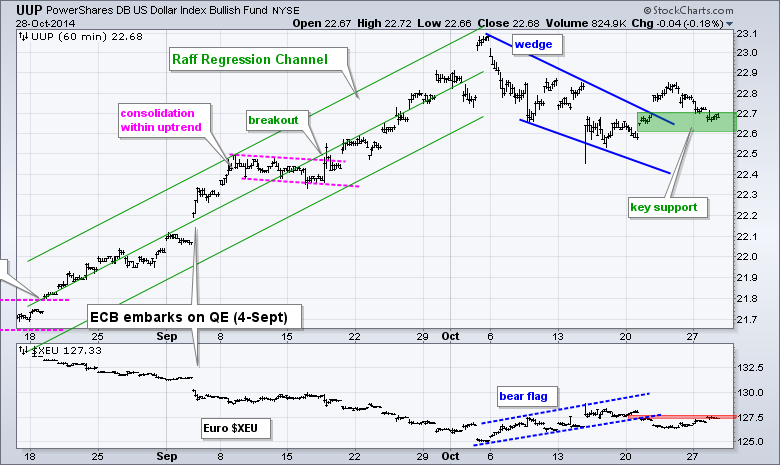
No change. The US Dollar ETF (UUP) broke wedge resistance with a surge above 22.7 and then stalled. Meanwhile, the Euro Index ($XEU) broke flag support to signal a continuation lower. The stress test for the EU banks is out and the Euro is holding firm on Monday morning. UUP broke wedge resistance with a surge and I am using this breakout zone to mark support in the 22.6-22.7 area. It is important that this breakout holds. A move below 22.6 would signal a failure. XEU resistance is set at 127.60.
**************************************************************
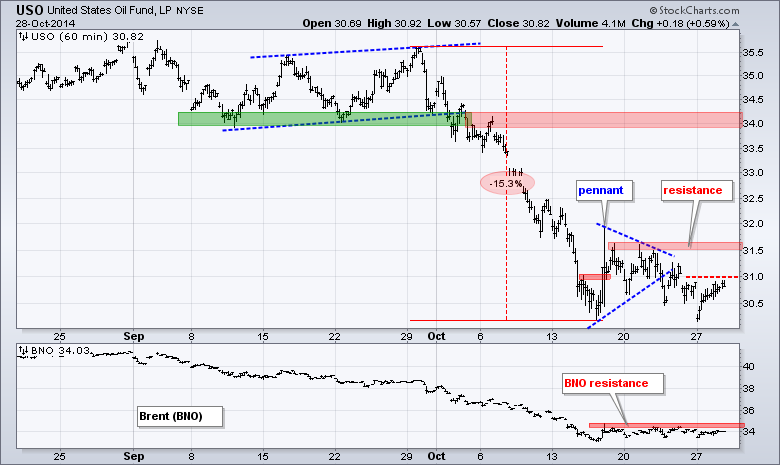
No change. The USO Oil Fund (USO) broke pennant support to signal a continuation of the prior decline. The break is holding for now, but the ETF is showing some signs of firmness in the 30.5-31 area. At this point, the pennant break is bearish until proven otherwise. A move above 31 would negate the pennant break and a move above 31.7 would break short-term resistance. A break above 31.7 would be bullish and target a bounce to the mid 30s. The indicator window shows the US Brent Oil ETF (BNO) with resistance at 35.
**************************************************************
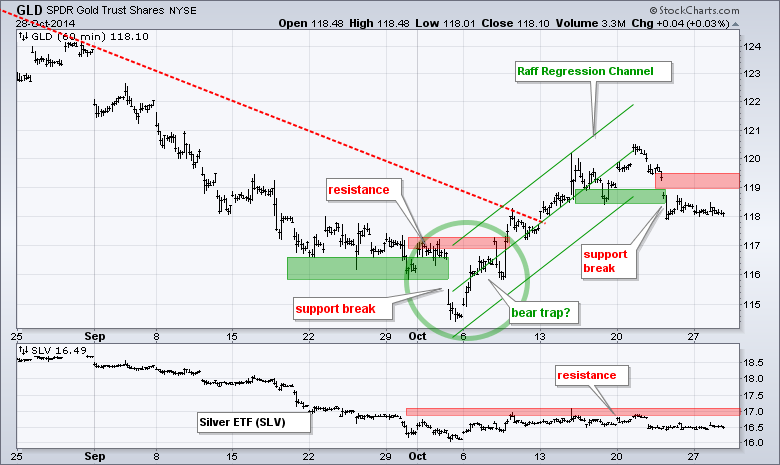
No change. The Gold SPDR (GLD) broke down last week and this break down is holding for now. The bigger trend is down and the October advance was a correction within this downtrend. The break down signals a continuation of the bigger downtrend. I will mark resistance in the 119-119.50 area. A move above 119.5 would negate the breakout and be bullish for gold. I will also be watching the Euro Index ($XEU) for a break above 127.60 because this would be Dollar bearish and gold bullish.
***************************************************************
Key Reports and Events (all times Eastern):
Wed - Oct 29 - 07:00 - MBA Mortgage Index
Wed - Oct 29 - 10:30 - Crude Oil Inventories
Wed - Oct 29 - 14:00 - FOMC Policy Statement
Thu - Oct 30 - 08:30 - Initial Jobless Claims
Thu - Oct 30 - 08:30 - GDP
Thu - Oct 30 - 10:30 - Natural Gas Inventories
Fri - Oct 31 - 08:30 - Personal Income & Spending
Fri - Oct 31 - 08:30 - PCE Prices
Fri - Oct 31 - 09:45 - Chicago PMI
Fri - Oct 31 - 09:55 - Michigan Sentiment
Charts of Interest are on Tuesdays and Thursdays.
This commentary and charts-of-interest are designed to stimulate thinking. This analysis is not a recommendation to buy, sell, hold or sell short any security (stock ETF or otherwise). We all need to think for ourselves when it comes to trading our own accounts. First, it is the only way to really learn. Second, we are the only ones responsible for our decisions. Think of these charts as food for further analysis. Before making a trade, it is important to have a plan. Plan the trade and trade the plan. Among other things, this includes setting a trigger level, a target area and a stop-loss level. It is also important to plan for three possible price movements: advance, decline or sideways. Have a plan for all three scenarios BEFORE making the trade. Consider possible holding times. And finally, look at overall market conditions and sector/industry performance.


