Stocks put in another positive day with bullish price action. The S&P 500 opened strong with a surge above 2080 and then worked its way higher to close at 2088. Once again, we are seeing the ability to start strong and finish strong. Stock market strength was broad with all major index ETFs rising around 1%. Eight of the nine sectors were up with four rising more than 1%. The Utilities SPDR (XLU) was the only decliner. The Materials SPDR (XLB) led the sector SPDRs and the Equal-weight Materials ETF (RTM) led the equal-weight sector ETFs.
**This chart analysis is for educational purposes only, and should not
be construed as a recommendation to buy, sell or sell-short said securities**
Short-term Overview (Friday, 13-February-2015):
- Short-term breadth turned bullish on 21-Jan and remains bullish.
- All five risk indicators are positive.
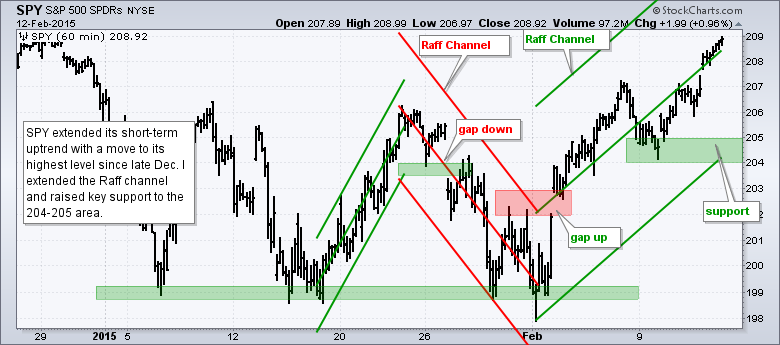
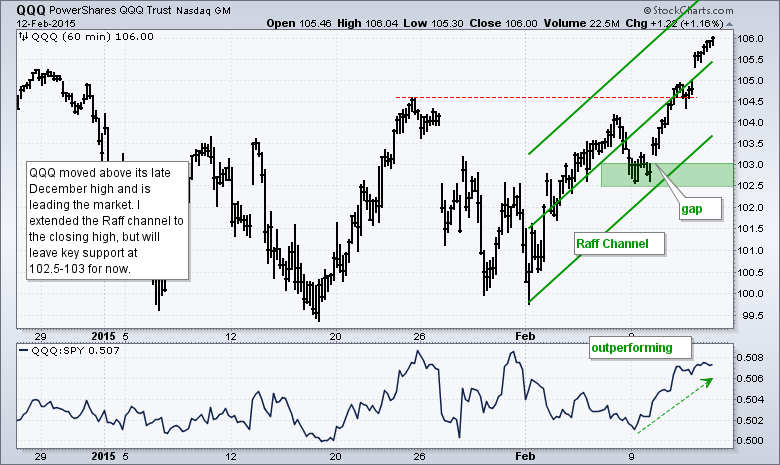
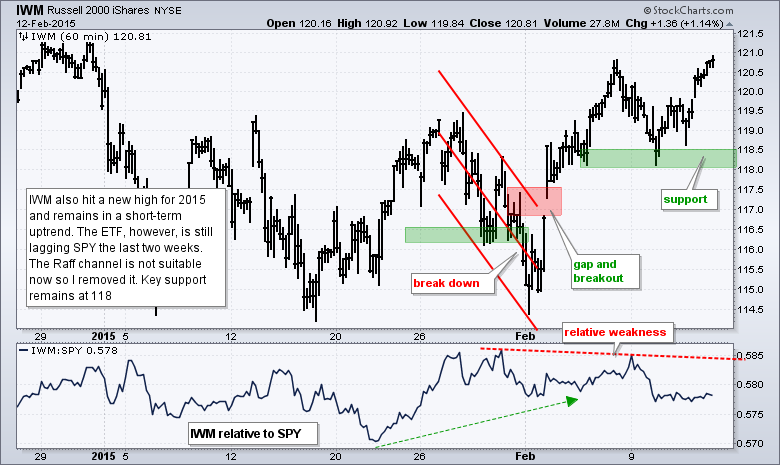
- SPY, QQQ and IWM hit new highs for 2015 and remain in short-term uptrends.
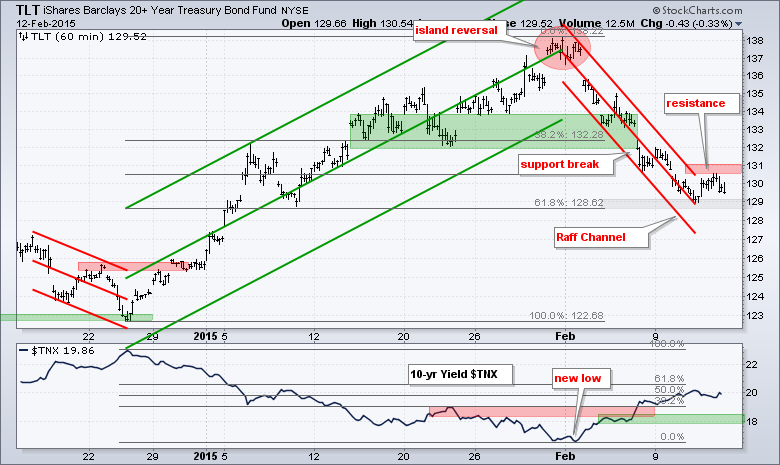
- TLT is in a short-term downtrend, but firming at a key retracement.
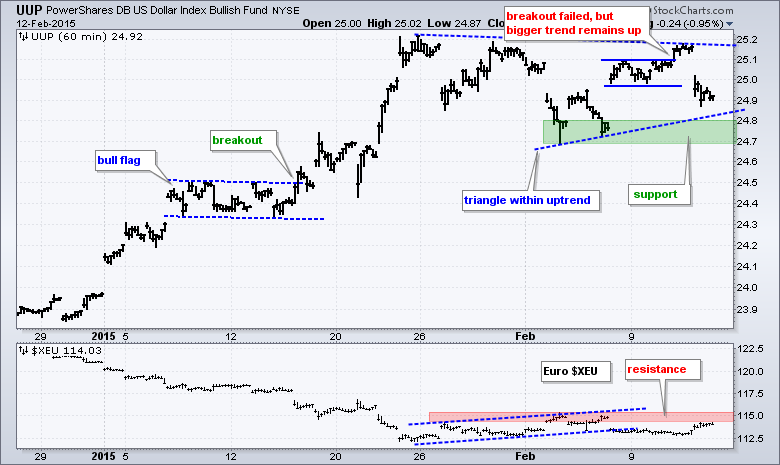
- UUP failed to hold its small breakout, but remains in an uptrend overall.
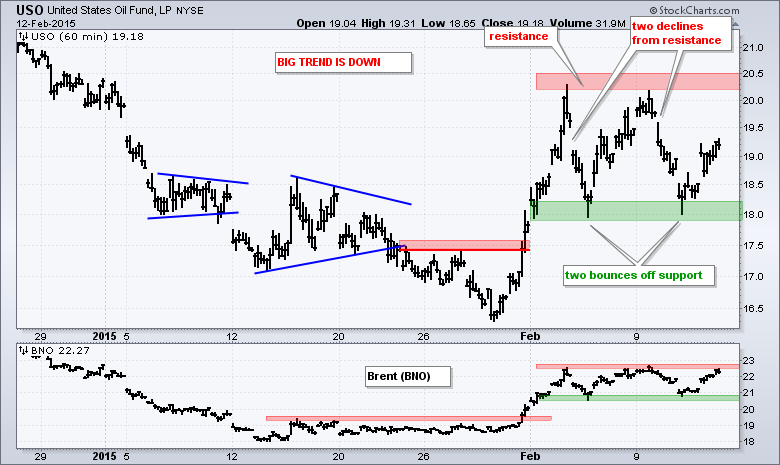
- USO is choppy and untradeable.
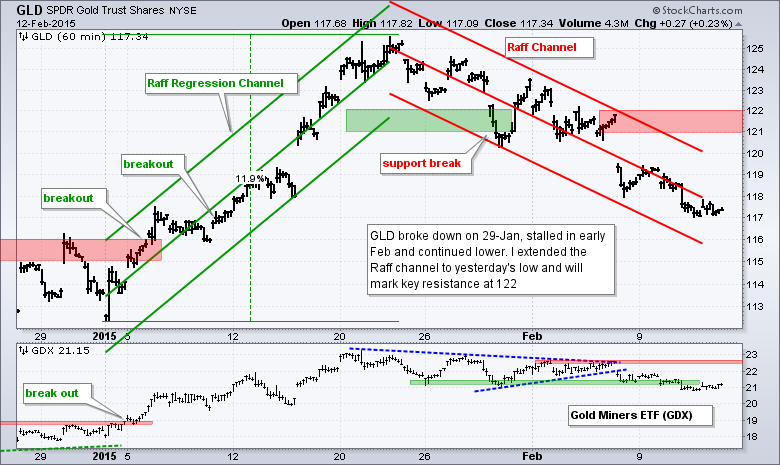
- GLD broke down on 29-Jan and extended its downtrend this week.
The E-mini moved higher for the third day and extended its triangle breakout. The advance may seem tepid, but there are no signs of weakness here.
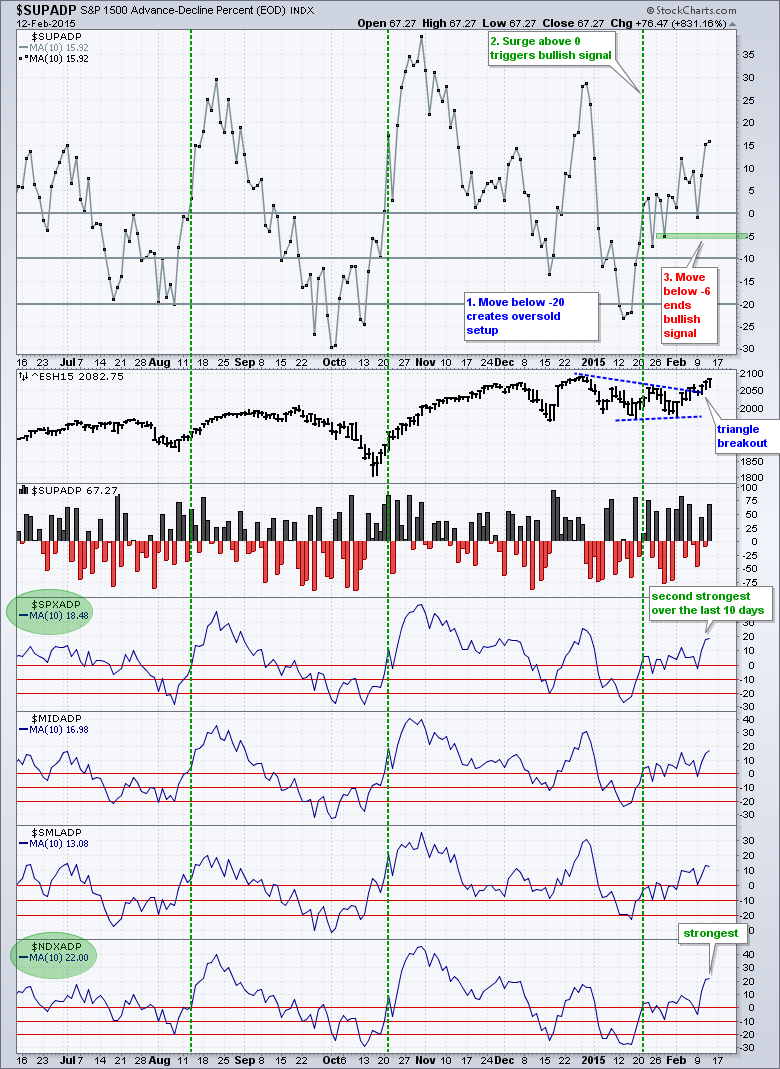
Breadth remains short-term bullish. Daily AD Percent exceeded 60% for the S&P 500, S&P Mid Cap 400, S&P Small Cap 600 and Nasdaq 100 on Thursday. The 10-day SMA for S&P 1500 AD Percent ($SUPADP) edged higher and extended its uptrend. I will stay bullish on breadth as long as this indicator holds above -6%.
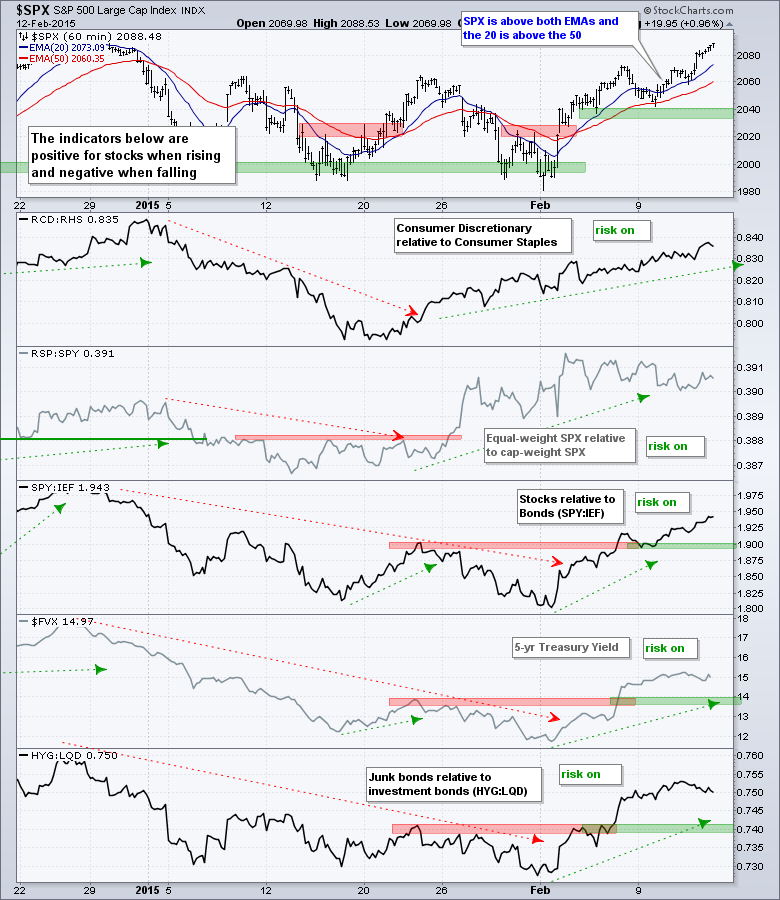
All five risk indicators remain positive for stocks. The Equal-Weight Consumer Discretionary ETF (RCD) is outperforming the Equal-weight Consumer Staples ETF (RHS). Relative performance in the Equal-Weight S&P 500 ETF (RSP) flattened over the last two weeks, but the ETF has been outperforming the S&P 500 SPDR (SPY) since mid January. Stocks have been outperforming Treasuries since early February and the 5-year Treasury Yield ($FVX) has been rising since then.
The short-term evidence remains bullish. Small-caps have been dragging their feet in February, but short-term breadth is still bullish overall. The five risk indicators are positive. Note that the Nasdaq 100 hit a 52-week high and is leading the market. The S&P 500 and Russell 2000 are within spitting distance of their late November highs.
**************************************************************
**************************************************************
**************************************************************
**************************************************************
**************************************************************
**************************************************************
***************************************************************
Key Reports and Events (all times Eastern):
Fri - Feb 13 - 09:55 - Michigan Sentiment
Tue - Feb 17 - 08:30 - Empire Manufacturing
Tue - Feb 17 - 10:00 - NAHB Housing Market Index
Wed - Feb 18 - 07:00 - MBA Mortgage Index
Wed - Feb 18 - 08:30 - Housing Starts/Building Permits
Wed - Feb 18 - 08:30 - Producer Price Index (PPI)
Wed - Feb 18 - 09:15 - Industrial Production
Wed - Feb 18 - 14:00 - FOMC Minutes
Thu - Feb 19 - 08:30 - Initial Jobless Claims
Thu - Feb 19 - 10:00 - Philadelphia Fed
Thu - Feb 19 - 10:00 - Leading Indicators
Thu - Feb 19 - 10:30 - Natural Gas Inventories
Thu - Feb 19 - 11:00 - Oil Inventories
Mon - Feb 23 - 10:00 - Existing Home Sales
Tue - Feb 24 - 09:00 - Case-Shiller 20-city Index
Tue - Feb 24 - 10:00 - Consumer Confidence
Wed - Feb 25 - 07:00 - MBA Mortgage Index
Wed - Feb 25 - 10:00 - New Home Sales
Wed - Feb 25 - 10:30 - Oil Inventories
Thu - Feb 26 - 08:30 - Initial Jobless Claims
Thu - Feb 26 - 08:30 - Consumer Price Index (CPI)
Thu - Feb 26 - 08:30 - Durable Goods Orders
Thu - Feb 26 - 09:00 - FHFA Housing Price Index
Thu - Feb 26 - 10:30 - Natural Gas Inventories
Fri - Feb 27 - 08:30 - GDP
Fri - Feb 27 - 09:45 - Chicago PMI
Fri - Feb 27 - 09:55 - Michigan Sentiment
Fri - Feb 27 - 10:00 - Pending Home Sales
This commentary is designed to stimulate thinking. This analysis is not a recommendation to buy, sell, hold or sell short any security (stock ETF or otherwise). We all need to think for ourselves when it comes to trading our own accounts. First, it is the only way to really learn. Second, we are the only ones responsible for our decisions. Think of these charts as food for further analysis. Before making a trade, it is important to have a plan. Plan the trade and trade the plan. Among other things, this includes setting a trigger level, a target area and a stop-loss level. It is also important to plan for three possible price movements: advance, decline or sideways. Have a plan for all three scenarios BEFORE making the trade. Consider possible holding times. And finally, look at overall market conditions and sector/industry performance.


