Stocks got right back to their bullish ways with the S&P 500 surging above 2117. The index started with a pop above 2113, dipped below 2100 and finished with a late surge to close near the high of the day. The major index ETFs finished higher with modest gains. QQQ led with a .90% gain, IWM added .73% and SPY tacked on .63%. Large-caps and small-caps led on Monday. Not bad. The Consumer Discretionary SPDR (XLY) led the sectors and utilities were slammed. Semis led techs as the Semiconductor SPDR (XSD) surged 2.5% on the heels of a big acquisition. The Broker-Dealer iShares (IAI) helped the finance sector with a 1.35% gain the Aerospace & Defense ETF (PPA) got its grove back with a 1.07% advance. All in all, it was a good day for stocks and we are left with the same situation: ripe for a pullback, but no signs of significant selling pressure.
**This chart analysis is for educational purposes only, and should not
be construed as a recommendation to buy, sell or sell-short said securities**
Short-term Overview (Tuesday, 3-March-2015):
- Breadth has been quite flat the last two weeks, but the 10-day Average still supports a short-term uptrend.
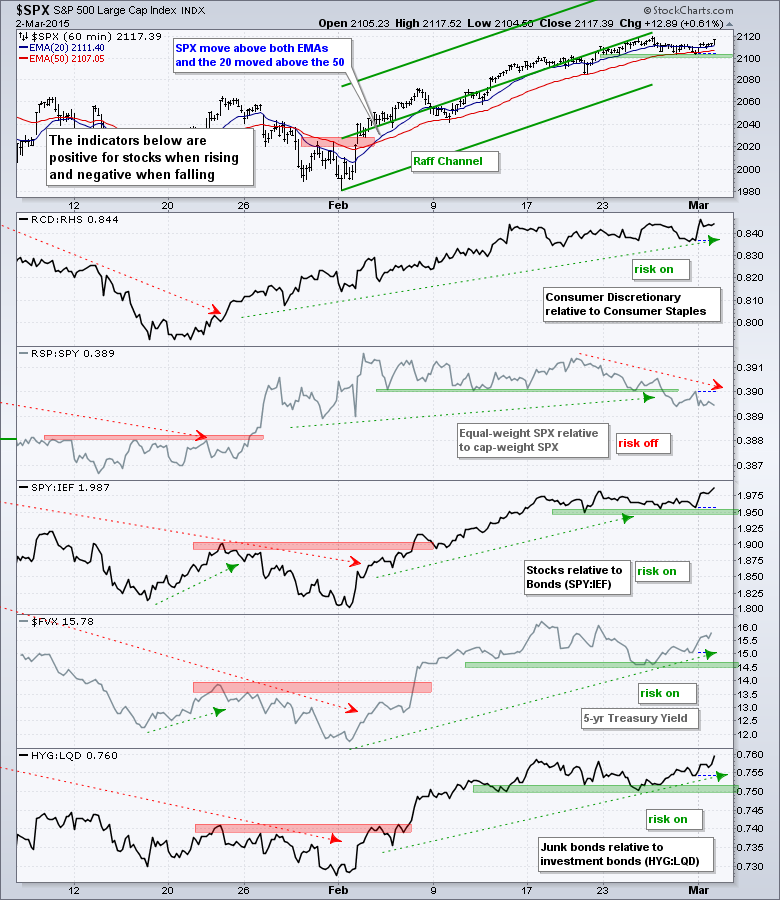
- The risk indicators are net positive for stocks.
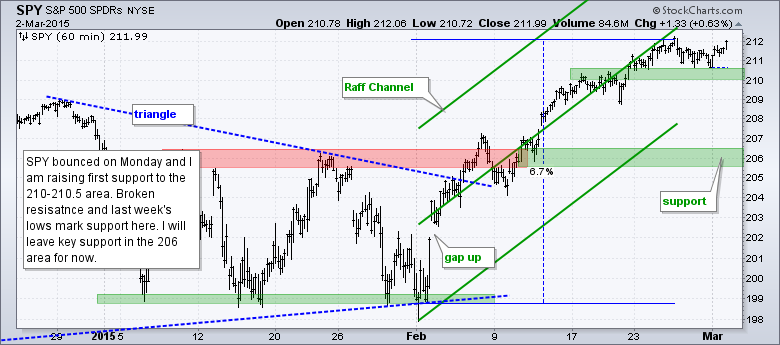
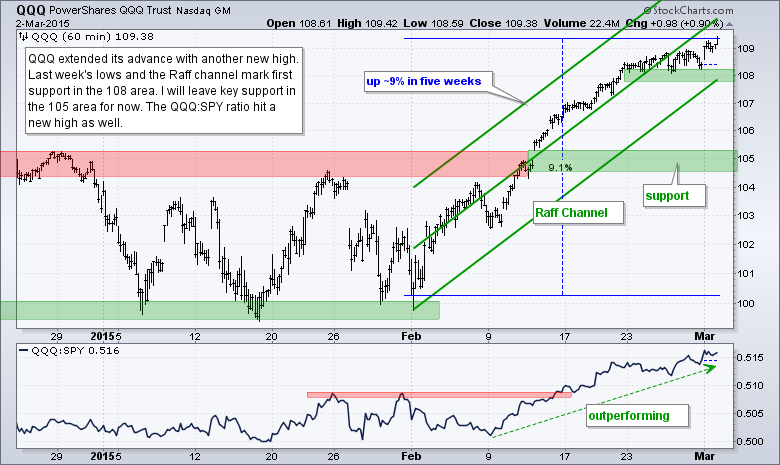
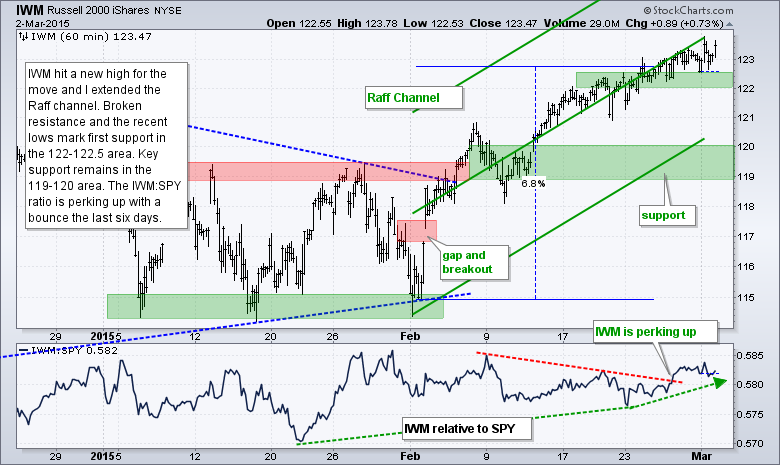
- SPY, QQQ and IWM are in short-term uptrends, but overbought after big moves in February.
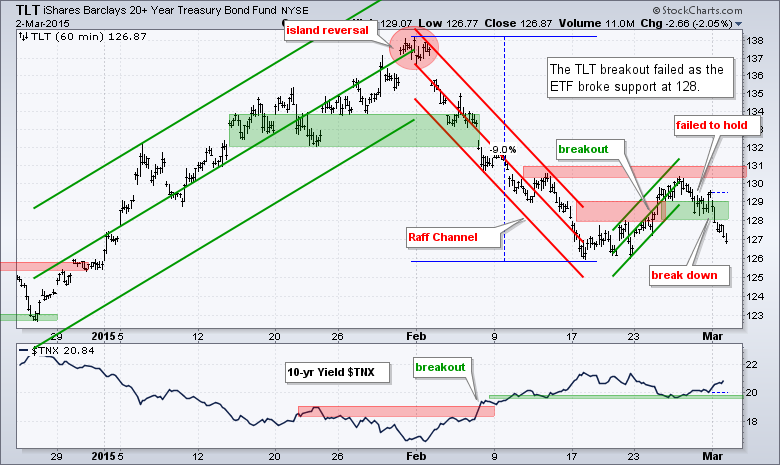
- TLT failed to hold its breakout and broke support on March 2nd.
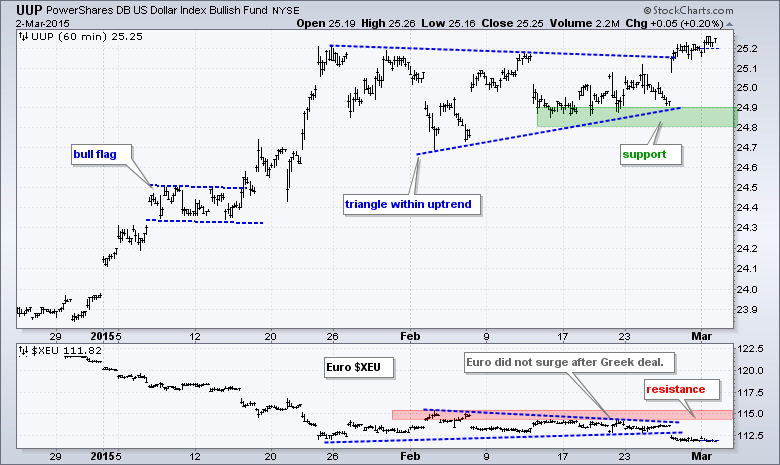
- UUP surged off the lower trend line of a triangle and broke above the upper trend line.
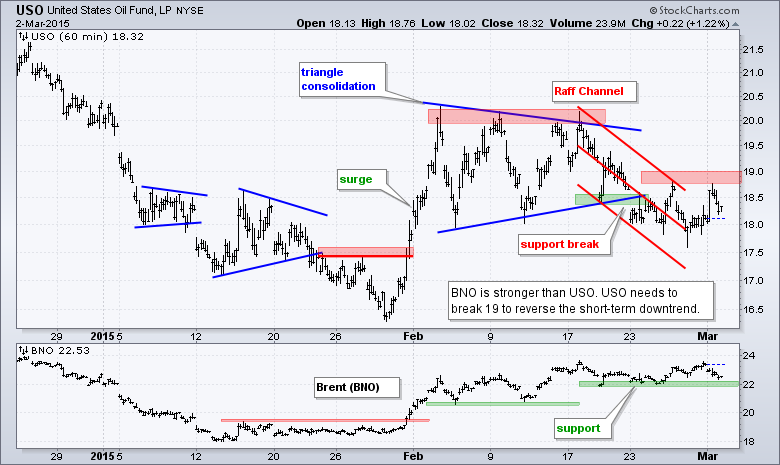
- USO is in a short-term downtrend and needs to clear 19 for a breakout.
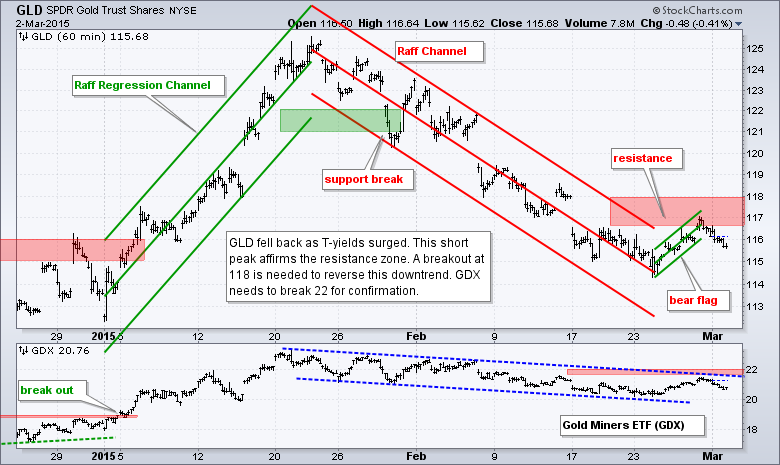
- GLD fell back from resistance, broke rising flag support and remains in a downtrend.
The incremental gains continue for the E-mini. After a three day pullback to the 2100 area, the E-mini popped with a move back above 2114. Overall, the triangle breakout on the daily chart remains and the breakout zone around 2050 turns first support.
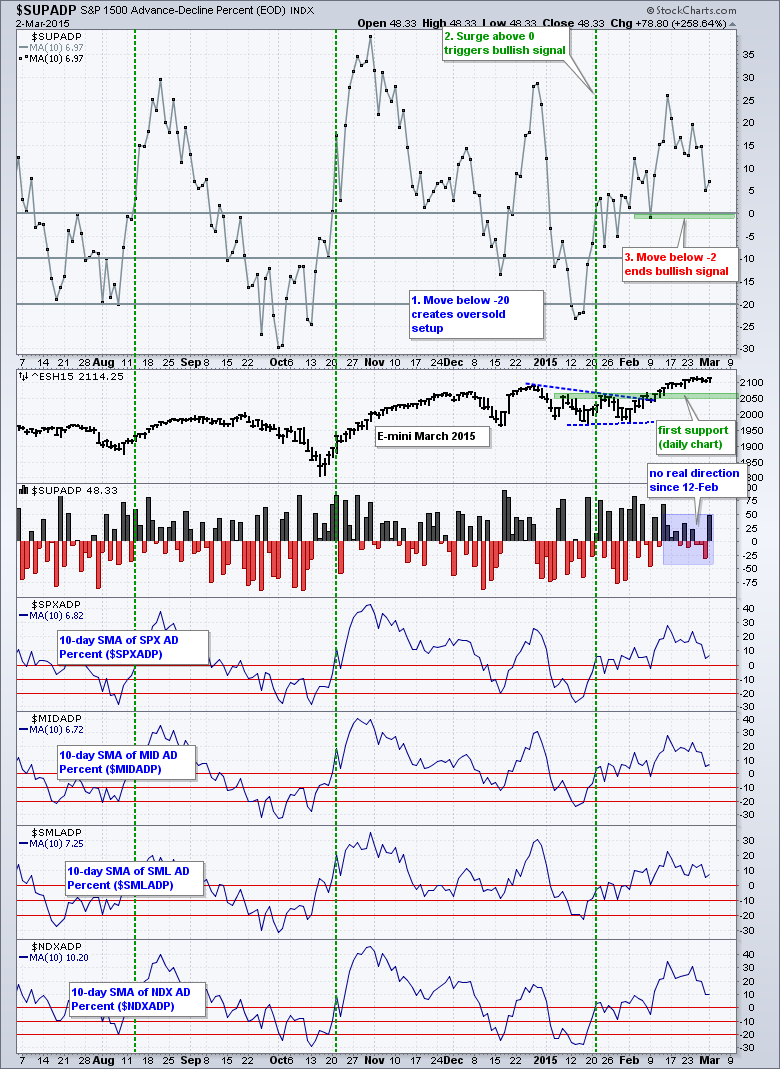
Breadth remains short-term bullish overall and we even got a positive pop on Monday. S&P 1500 AD Percent ($SUPADP) exceeded 45% for the first time since February 12th. Truth be told, it is not that big of a pop and definitely does not qualify as a breadth thrust. Breadth has been quite flat the last two weeks. Overall, the 10-day SMA for S&P 1500 AD Percent remains in positive territory and supports an uptrend in stocks. A big down day today could change that because the 10-day average will lose a +67% day (12-Feb) tomorrow.
The risk indicators remain net positive for stocks and the three bond indicators turned up sharply. The only negative indicator is the RSP:SPY ratio because the equal-weight S&P 500 is underperforming the cap-weight S&P 500. This shows a preference for large-caps. Treasuries moved sharply lower though and the SPY:IEF ratio is nearing its late December high. The 5-year Treasury Yield ($FVX) moved above 1.55%. The HYG:LQD ratio surged and is also challenging its late December high. Relative strength in junk bonds shows a healthy risk appetite in the bond market.
There is not much change in the short-term situation for stocks. The risk indicators are net positive, breadth still supports the uptrend and the major index ETFs have been trending higher since early February. The trend is getting long in tooth (short-term) and ripe for a rest, but I do not see any bearish evidence right now. Overbought and overextended do not count as bearish. They are merely observations that the reward-to-risk ratio for new long positions is not palatable.
**************************************************************
**************************************************************
**************************************************************
**************************************************************
**************************************************************
**************************************************************
***************************************************************
Key Reports and Events (all times Eastern):
Tue - Mar 03 - 14:00 - Auto-Truck Sales
Wed - Mar 04 - 07:00 - MBA Mortgage Index
Wed - Mar 04 - 08:15 - ADP Employment Report
Wed - Mar 04 - 10:00 - ISM Services Index
Wed - Mar 04 - 10:30 - Crude Oil Inventories
Wed - Mar 04 - 14:00 - Fed Beige Book
Thu - Mar 05 - 07:30 - Challenger Job Report
Thu - Mar 05 - 08:30 - Initial Jobless Claims
Thu - Mar 05 - 10:00 - Factory Orders
Thu - Mar 05 - 10:30 - Natural Gas Inventories
Fri - Mar 06 - 08:30 - Employment Report
Fri - Mar 06 - 15:00 - Consumer Credit
Tue - Mar 10 - 10:00 - JOLTS
Tue - Mar 10 - 10:00 - Wholesale Inventories
Wed - Mar 11 - 07:00 - MBA Mortgage Index
Wed - Mar 11 - 10:30 - Crude Oil Inventories
Thu - Mar 12 - 08:30 - Initial Jobless Claims
Thu - Mar 12 - 08:30 - Retail Sales
Thu - Mar 12 - 10:00 - Business Inventories
Thu - Mar 12 - 10:30 - Natural Gas Inventories
Fri - Mar 13 - 08:30 - Producer Price Index (PPI)
Fri - Mar 13 - 10:00 - Michigan Sentiment
Mon - Mar 16 - 08:30 - Empire State Manufacturing
Mon - Mar 16 - 09:15 - Industrial Production
Mon - Mar 16 - 10:00 - NAHB Housing Market Index
Tue - Mar 17 - 08:30 - Building Permits-Housing Starts
Wed - Mar 18 - 07:00 - MBA Mortgage Index
Wed - Mar 18 - 10:30 - Crude Oil Inventories
Wed - Mar 18 - 14:00 - FOMC Rate Decision
Thu - Mar 19 - 08:30 - Initial Jobless Claims
Thu - Mar 19 - 10:00 - Philadelphia Fed
Thu - Mar 19 - 10:00 - Leading Economic Indicators
Thu - Mar 19 - 10:30 - Natural Gas Inventories
Mon - Mar 23 - 10:00 - Existing Home Sales
Tue - Mar 24 - 08:30 - Consumer Price Index (CPI)
Tue - Mar 24 - 09:00 - FHFA Housing Price Index
Tue - Mar 24 - 10:00 - New Home Sales
Wed - Mar 25 - 07:00 - MBA Mortgage Index
Wed - Mar 25 - 08:30 - Durable Orders
Wed - Mar 25 - 10:30 - Crude Oil Inventories
Thu - Mar 26 - 08:30 - Initial Jobless Claims
Thu - Mar 26 - 10:30 - Natural Gas Inventories
Fri - Mar 27 - 08:30 - GDP
Fri - Mar 27 - 10:00 - Michigan Sentiment
This commentary is designed to stimulate thinking. This analysis is not a recommendation to buy, sell, hold or sell short any security (stock ETF or otherwise). We all need to think for ourselves when it comes to trading our own accounts. First, it is the only way to really learn. Second, we are the only ones responsible for our decisions. Think of these charts as food for further analysis. Before making a trade, it is important to have a plan. Plan the trade and trade the plan. Among other things, this includes setting a trigger level, a target area and a stop-loss level. It is also important to plan for three possible price movements: advance, decline or sideways. Have a plan for all three scenarios BEFORE making the trade. Consider possible holding times. And finally, look at overall market conditions and sector/industry performance.


