The S&P 500 did a repeat of Tuesday as the index opened weak with a plunge below 2090, quickly firmed and then recovered half the plunge with a bounce to the 2099 area. Selling pressure was pretty much across the board, but the declines were modest. Eight of the nine sector SPDRs were down and the biggest decline was .78% (XLI). The HealthCare SPDR (XLV) bucked the selling pressure as BMY surged around 6%. The Home Construction iShares (ITB) also bucked the selling pressure with a small gain. Biotechs stole the show yet again as the Biotech SPDR (XBI) surged 2% and hit yet another new high.
**This chart analysis is for educational purposes only, and should not
be construed as a recommendation to buy, sell or sell-short said securities**
Short-term Overview (Thursday, 5-March-2015):
- Breadth turned short-term bearish on March 4th.
- The risk indicators remain net positive for stocks.
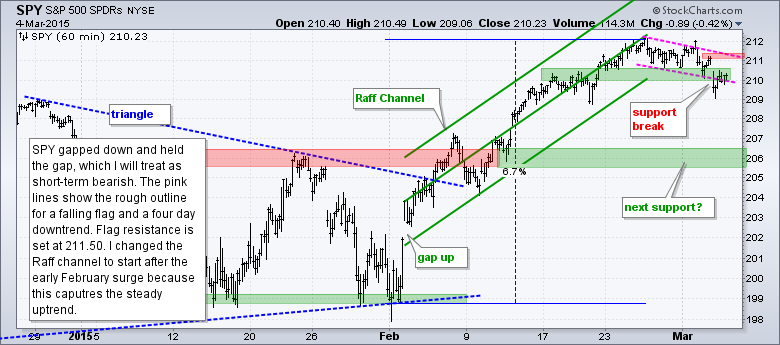
- SPY broke short-term support on March 4th.
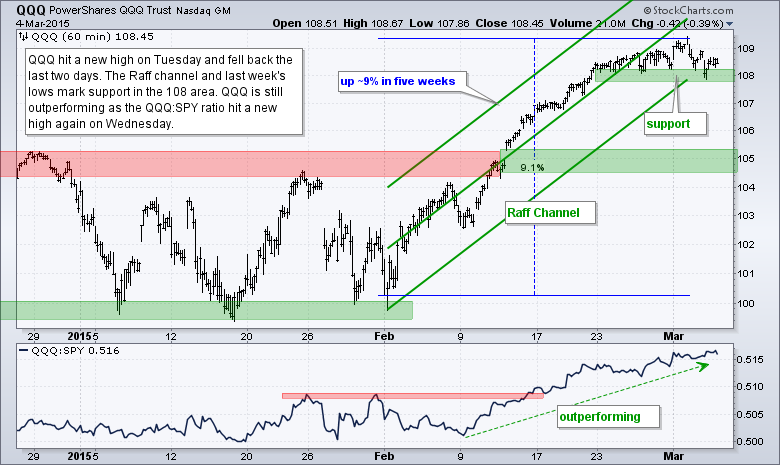
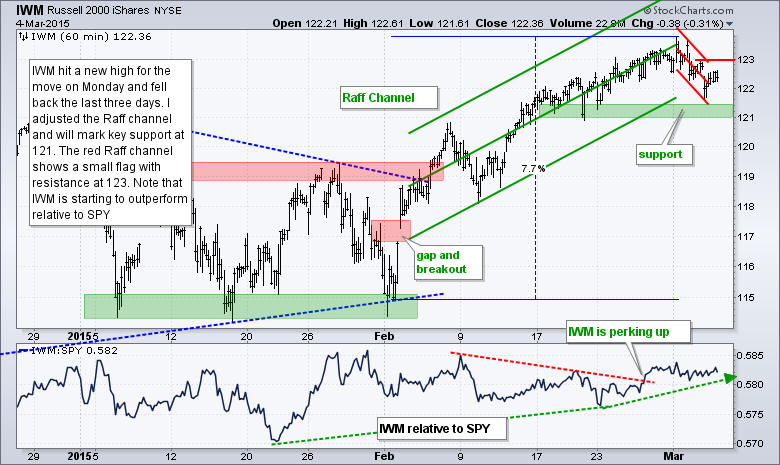
- QQQ and IWM remain above short-term support and in uptrends.
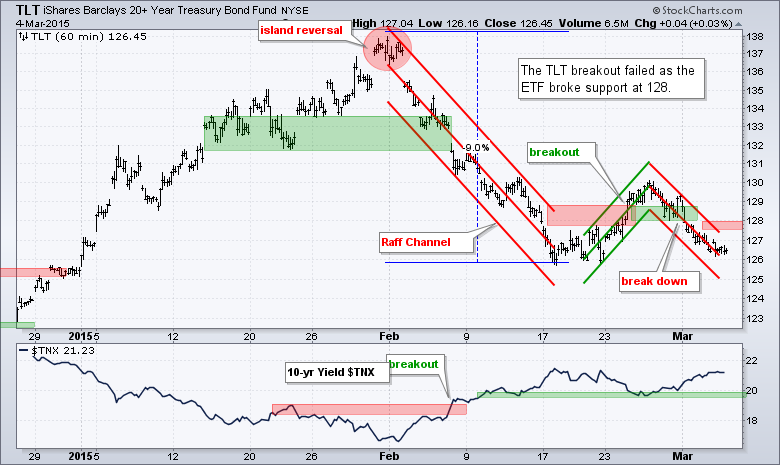
- TLT failed to hold its breakout and broke support on March 2nd.
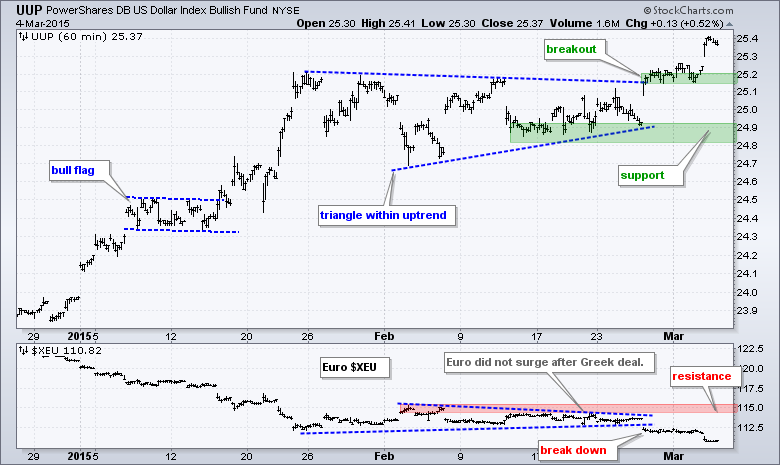
- UUP surged off the lower trend line of a triangle and broke above the upper trend line on 27-Feb.
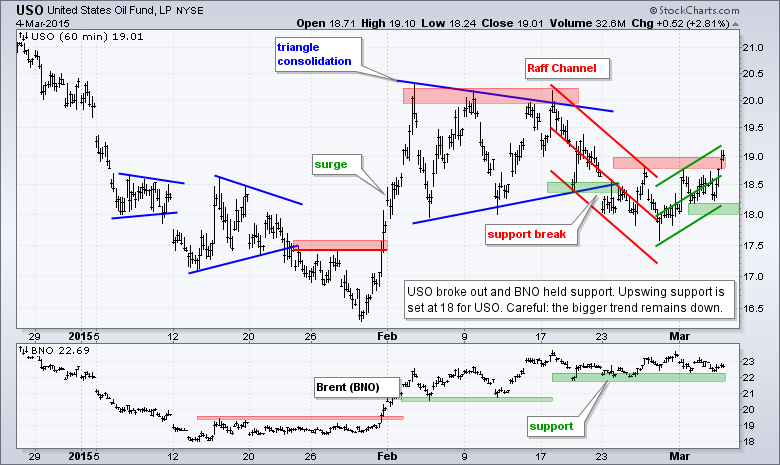
- USO broke short-term resistance on March 4th to start a short-term uptrend.
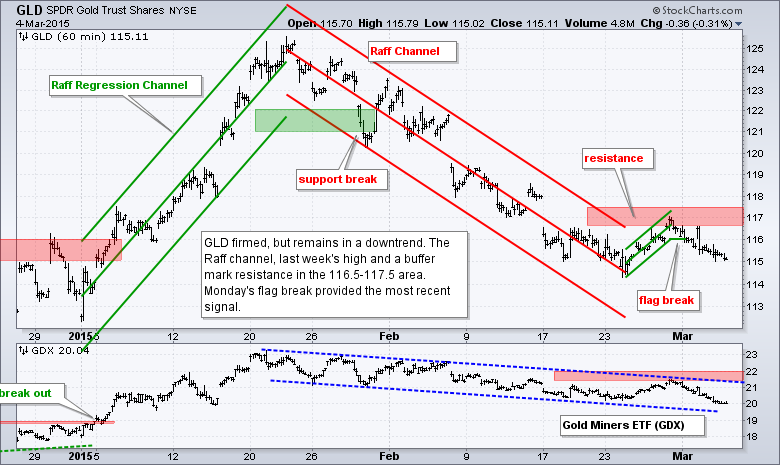
- GLD remains in a downtrend with resistance set at 117.50
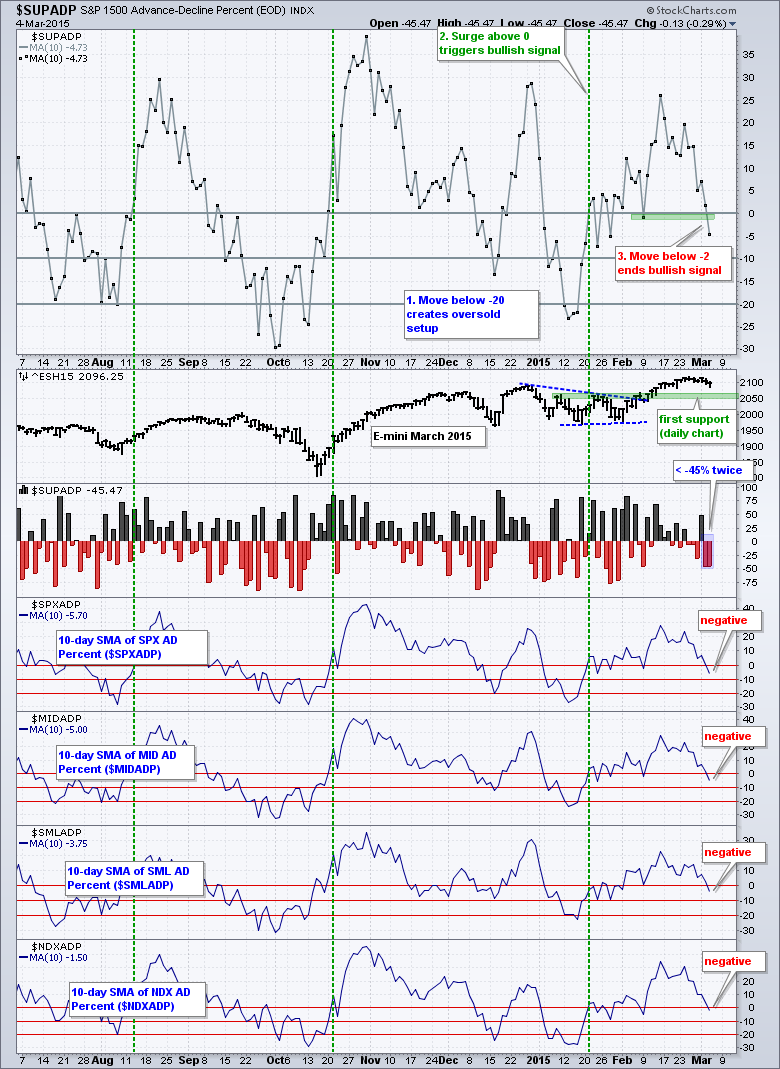
Breadth took another hit as S&P 1500 AD Percent ($SUPADP) dipped below -45% for the second time in as many days. With this negative reading, the 10-day SMA broke below -2% and turned bearish. Also note that the 10-day SMAs for AD Percent moved into negative territory for the S&P 500, S&P Small-Cap 600, S&P MidCap 400 and Nasdaq 100. There is still a chance of a whipsaw because the indicator is close to the zero line. A surge back above +5% would call for a reevaluation.
On the 60-minute bar chart, the 20-period EMA moved below the 50-period EMA for the first time since early February. The S&P 500 also moved below both moving averages. The two stock-related risk indicators are split. The consumer discretionary sector is outperforming the consumer staples sector, but the equal-weight S&P 500 is underperforming the cap-weight S&P 500. This shows a bit of risk aversion in the S&P 500.
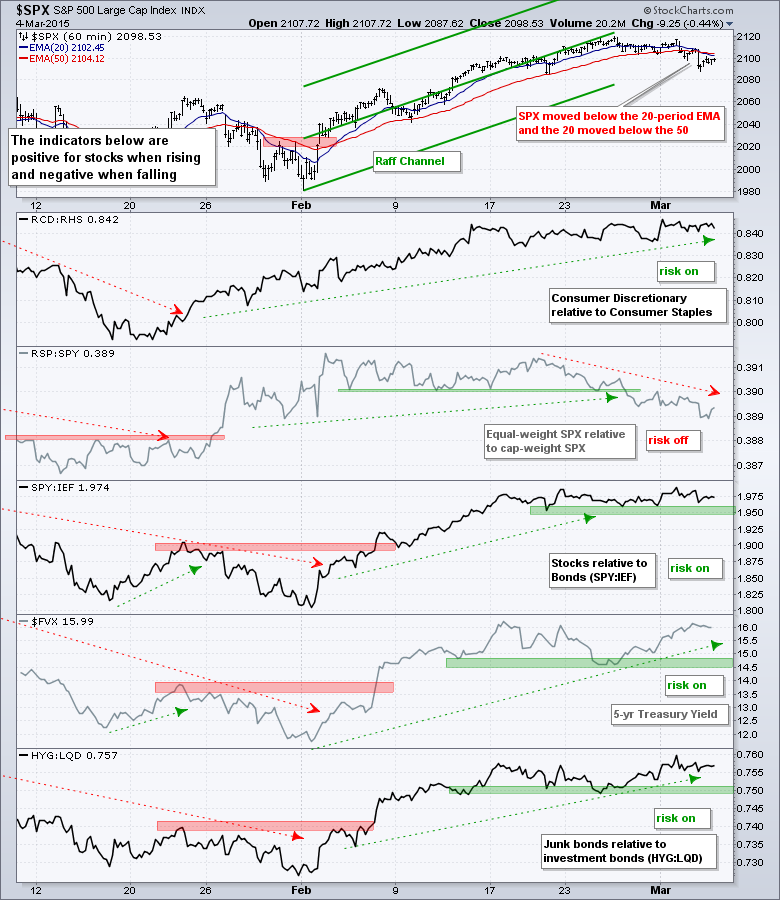
The bond related indicators are still positive. The SPY:IEF ratio flattened out over the last three weeks, but has yet to break down. Stocks are still outperforming bonds overall. The 5-year Treasury Yield ($FVX) is also in an uptrend and junk bonds are outperforming investment grade bonds. This could be because oil got a small breakout on Wednesday.
The stock market is turning mixed, and the employment report looms on Friday. I do not have a prediction for the report, but it can cause above average volatility. The major index ETFs are in long-term uptrends, but I am seeing some short-term weakness. SPY broke support, but QQQ and IWM are above support. Breadth broke down, but the risk indicators remain positive. At this stage, I am still erring on the bullish side and am not tempted to short the stock market because the bigger trend is up.
**************************************************************
**************************************************************
**************************************************************
**************************************************************
**************************************************************
**************************************************************
***************************************************************
Key Reports and Events (all times Eastern):
Thu - Mar 05 - 07:30 - Challenger Job Report
Thu - Mar 05 - 08:30 - Initial Jobless Claims
Thu - Mar 05 - 10:00 - Factory Orders
Thu - Mar 05 - 10:30 - Natural Gas Inventories
Fri - Mar 06 - 08:30 - Employment Report
Fri - Mar 06 - 15:00 - Consumer Credit
Tue - Mar 10 - 10:00 - JOLTS
Tue - Mar 10 - 10:00 - Wholesale Inventories
Wed - Mar 11 - 07:00 - MBA Mortgage Index
Wed - Mar 11 - 10:30 - Crude Oil Inventories
Thu - Mar 12 - 08:30 - Initial Jobless Claims
Thu - Mar 12 - 08:30 - Retail Sales
Thu - Mar 12 - 10:00 - Business Inventories
Thu - Mar 12 - 10:30 - Natural Gas Inventories
Fri - Mar 13 - 08:30 - Producer Price Index (PPI)
Fri - Mar 13 - 10:00 - Michigan Sentiment
Mon - Mar 16 - 08:30 - Empire State Manufacturing
Mon - Mar 16 - 09:15 - Industrial Production
Mon - Mar 16 - 10:00 - NAHB Housing Market Index
Tue - Mar 17 - 08:30 - Building Permits-Housing Starts
Wed - Mar 18 - 07:00 - MBA Mortgage Index
Wed - Mar 18 - 10:30 - Crude Oil Inventories
Wed - Mar 18 - 14:00 - FOMC Rate Decision
Thu - Mar 19 - 08:30 - Initial Jobless Claims
Thu - Mar 19 - 10:00 - Philadelphia Fed
Thu - Mar 19 - 10:00 - Leading Economic Indicators
Thu - Mar 19 - 10:30 - Natural Gas Inventories
Mon - Mar 23 - 10:00 - Existing Home Sales
Tue - Mar 24 - 08:30 - Consumer Price Index (CPI)
Tue - Mar 24 - 09:00 - FHFA Housing Price Index
Tue - Mar 24 - 10:00 - New Home Sales
Wed - Mar 25 - 07:00 - MBA Mortgage Index
Wed - Mar 25 - 08:30 - Durable Orders
Wed - Mar 25 - 10:30 - Crude Oil Inventories
Thu - Mar 26 - 08:30 - Initial Jobless Claims
Thu - Mar 26 - 10:30 - Natural Gas Inventories
Fri - Mar 27 - 08:30 - GDP
Fri - Mar 27 - 10:00 - Michigan Sentiment
This commentary is designed to stimulate thinking. This analysis is not a recommendation to buy, sell, hold or sell short any security (stock ETF or otherwise). We all need to think for ourselves when it comes to trading our own accounts. First, it is the only way to really learn. Second, we are the only ones responsible for our decisions. Think of these charts as food for further analysis. Before making a trade, it is important to have a plan. Plan the trade and trade the plan. Among other things, this includes setting a trigger level, a target area and a stop-loss level. It is also important to plan for three possible price movements: advance, decline or sideways. Have a plan for all three scenarios BEFORE making the trade. Consider possible holding times. And finally, look at overall market conditions and sector/industry performance.


