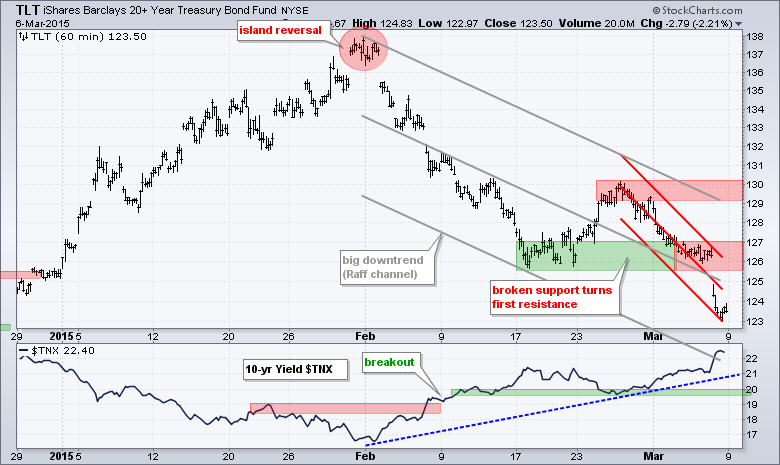
Selling pressure hit both stocks and bonds last week, but bonds more so than stocks. The S&P 500 fell around 1.5% for the week, which is not a drastic decline by any means. The 20+ YR T-Bond ETF (TLT) fell 4.5% last week and is down around 10% the last five weeks. A lot of money moved out of the bond market last week and this money needs to be reallocated. Perhaps some of it will find its way into the stock market. All sectors were down last week. Finance and healthcare held up the best. Utilities fared the worst because they are sensitive to rising interest rates. REITs were also hit hard. Note that the Regional Bank SPDR (KRE) and Broker-Dealer iShares (IAI) finished with gains for the week and showed relative strength. The Biotech SPDR (XBI) and Biotech iShares (IBB) also finished with gains, but these two are looking quite frothy.
**This chart analysis is for educational purposes only, and should not
be construed as a recommendation to buy, sell or sell-short said securities**
Short-term Overview (Monday, 9-March-2015):
- Breadth turned short-term bearish on March 4th.
- The risk indicators remain net positive for stocks.
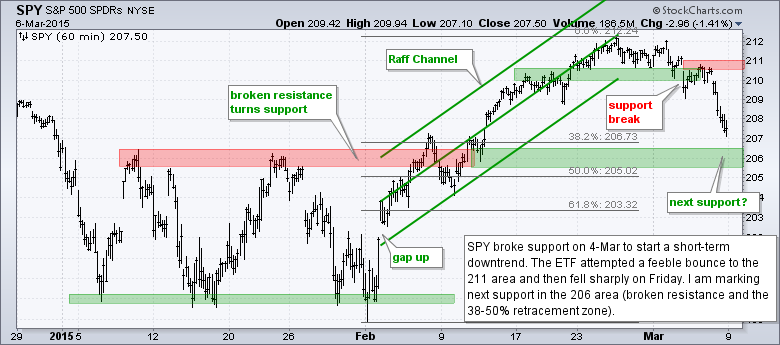
- SPY broke short-term support on March 4th.
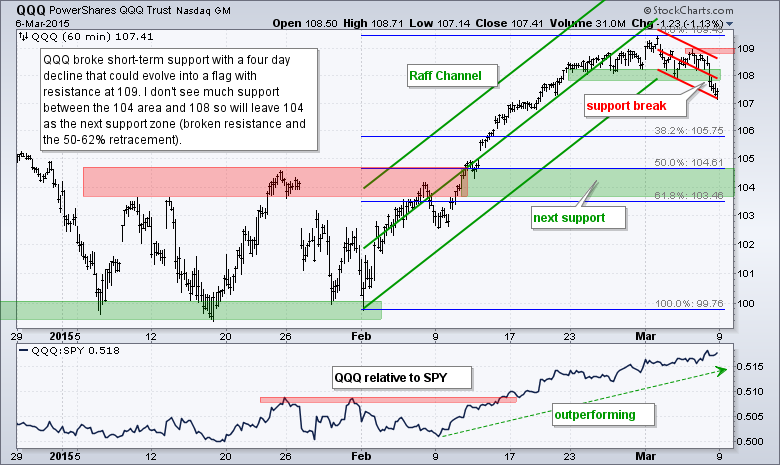
- QQQ broke short-term support on March 6th.
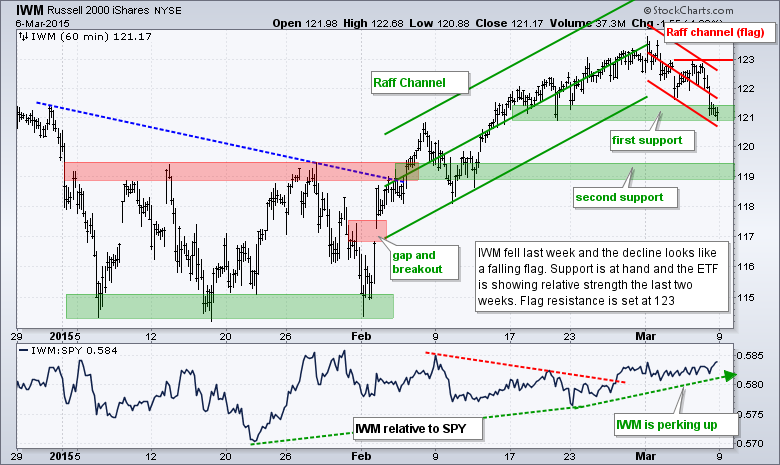
- IWM is right at support and showing relative strength.
- TLT broke support on March 2nd and plunged to new lows.
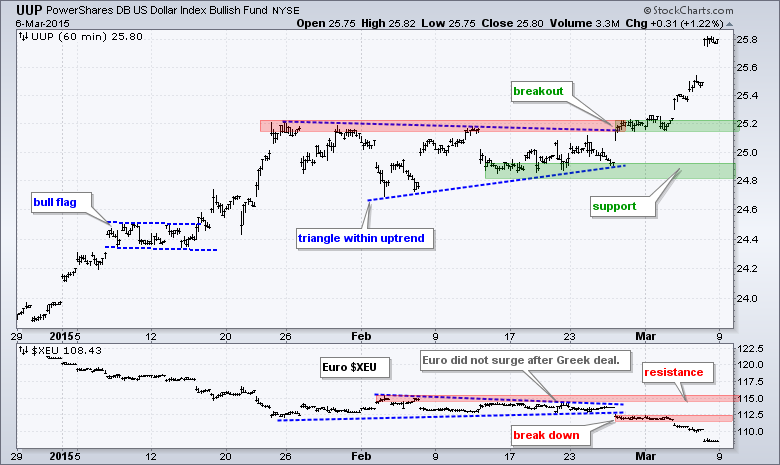
- UUP surged off the lower trend line of a triangle and broke above the upper trend line on 27-Feb.
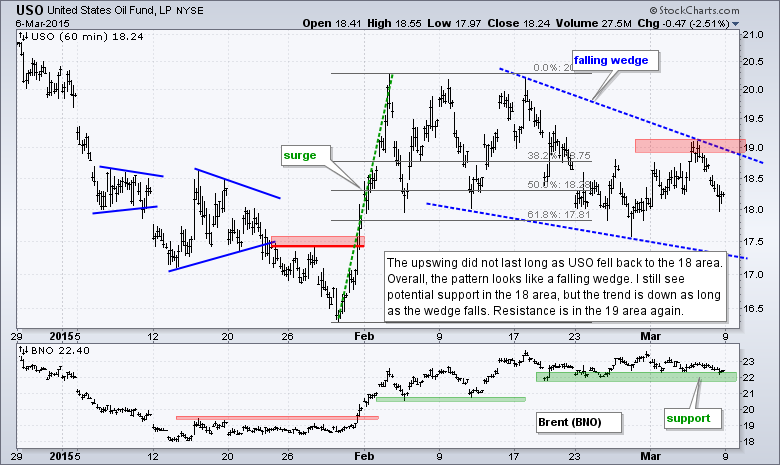
- USO failed to hold its gains and fell back into a falling wedge pattern.
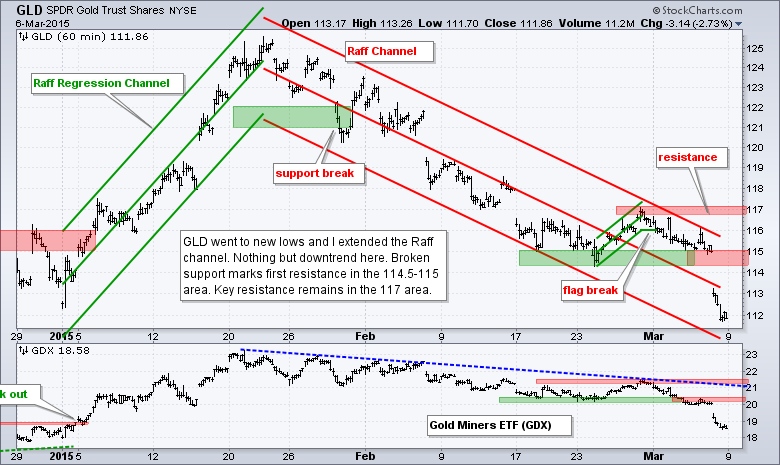
- GLD plunged to new lows last week and has been in a downtrend since 29-Jan.
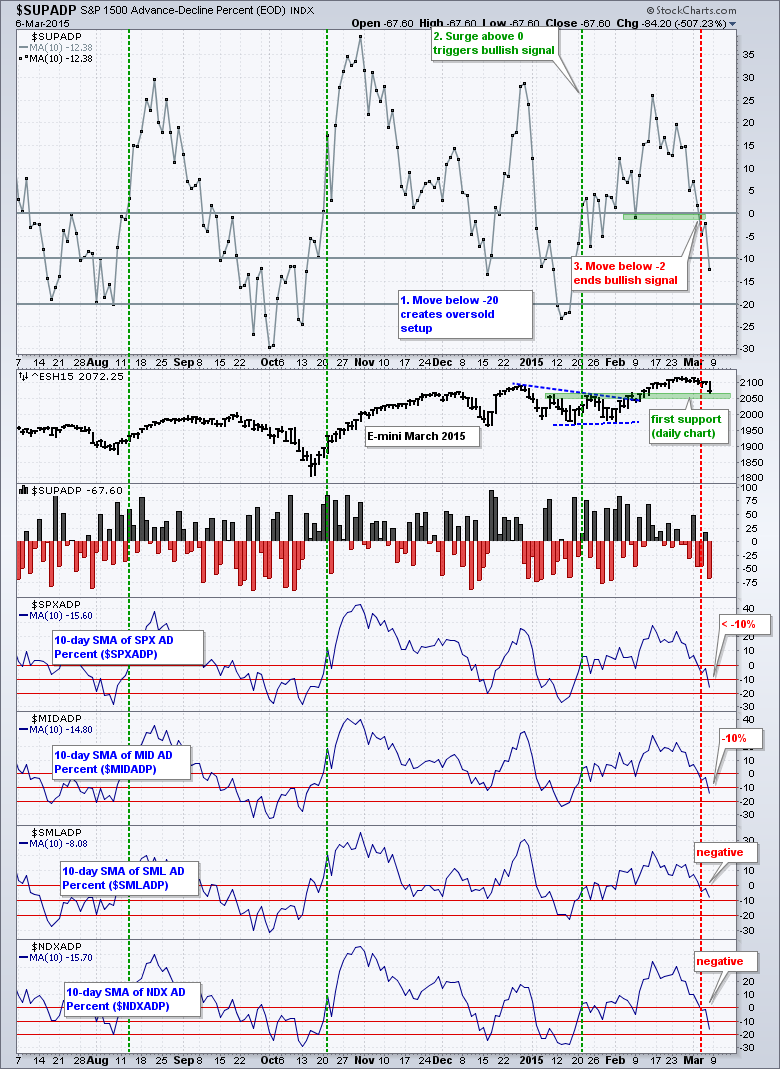
Breadth plunged as selling pressure expanded on Friday. S&P 1500 AD Percent ($SUPADP) finished below -60% for the first time since late January. The 10-day SMA broke -2% on Wednesday to negate its bullish signal. This indicator continued below -10% and the next stop is -20%. The three step setup is: oversold (below -20%), bull trigger (surge above 0) and signal negation.
On the 60-minute S&P 500 chart, the 20-period EMA moved below the 50-period EMA on March 4th, and the S&P 500 moved below both moving averages that same day. The two stock-related risk indicators remain split. The consumer discretionary sector is outperforming the consumer staples sector (positive), but the equal-weight S&P 500 is underperforming the cap-weight S&P 500 (negative). For now, the bearish EMA cross and relative weakness in the equal-weight S&P 500 tilt towards the bears.
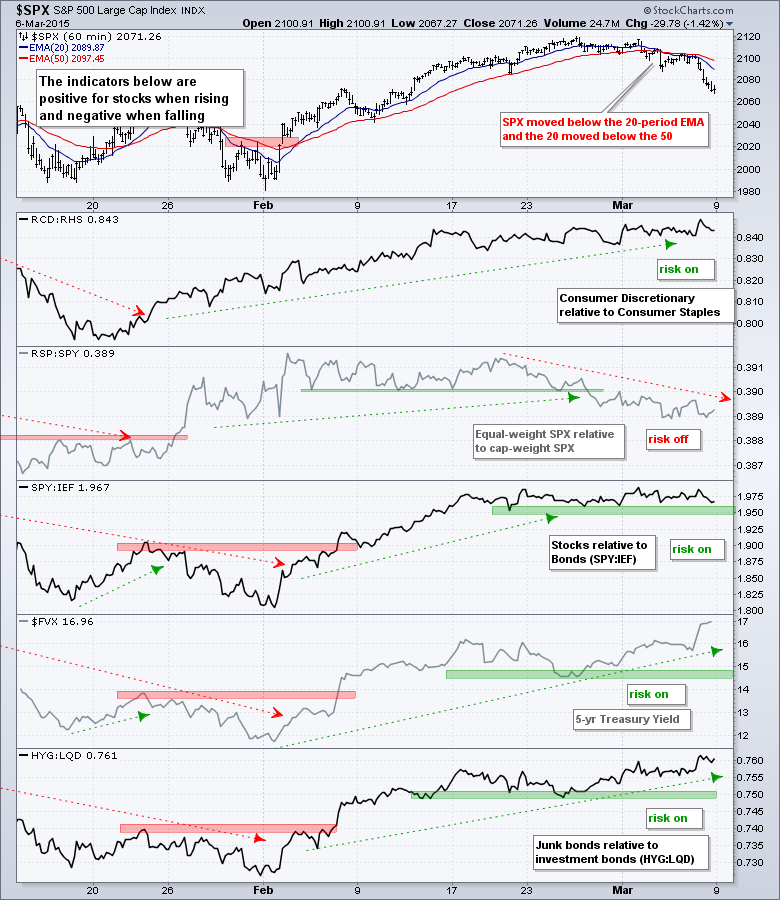
The bond related indicators remain positive because bonds were hit harder than stocks on Friday. The SPY:IEF ratio flattened because both stocks and bonds fell on Friday. The 5-year Treasury Yield ($FVX) surged to 1.7% and remains in an uptrend, which means money is moving out of short-term Treasuries. Junk bonds are outperforming investment grade bonds.
The short-term evidence favors the bears. Breadth took its biggest negative hit in over a month, the S&P 500 triggered a bearish EMA cross last week and the average stock in the S&P 500 is underperforming. SPY and QQQ broke short-term support last week, but IWM is at support and showing some relative strength. I still think this is a short-term downtrend within a bigger uptrend and will be watching for a bullish setup in the coming days or weeks. No telling how long a corrective period will extend.
**************************************************************
**************************************************************
**************************************************************
**************************************************************
**************************************************************
**************************************************************
***************************************************************
Key Reports and Events (all times Eastern):
Tue - Mar 10 - 10:00 - JOLTS
Tue - Mar 10 - 10:00 - Wholesale Inventories
Wed - Mar 11 - 07:00 - MBA Mortgage Index
Wed - Mar 11 - 10:30 - Crude Oil Inventories
Thu - Mar 12 - 08:30 - Initial Jobless Claims
Thu - Mar 12 - 08:30 - Retail Sales
Thu - Mar 12 - 10:00 - Business Inventories
Thu - Mar 12 - 10:30 - Natural Gas Inventories
Fri - Mar 13 - 08:30 - Producer Price Index (PPI)
Fri - Mar 13 - 10:00 - Michigan Sentiment
Mon - Mar 16 - 08:30 - Empire State Manufacturing
Mon - Mar 16 - 09:15 - Industrial Production
Mon - Mar 16 - 10:00 - NAHB Housing Market Index
Tue - Mar 17 - 08:30 - Building Permits-Housing Starts
Wed - Mar 18 - 07:00 - MBA Mortgage Index
Wed - Mar 18 - 10:30 - Crude Oil Inventories
Wed - Mar 18 - 14:00 - FOMC Rate Decision
Thu - Mar 19 - 08:30 - Initial Jobless Claims
Thu - Mar 19 - 10:00 - Philadelphia Fed
Thu - Mar 19 - 10:00 - Leading Economic Indicators
Thu - Mar 19 - 10:30 - Natural Gas Inventories
Mon - Mar 23 - 10:00 - Existing Home Sales
Tue - Mar 24 - 08:30 - Consumer Price Index (CPI)
Tue - Mar 24 - 09:00 - FHFA Housing Price Index
Tue - Mar 24 - 10:00 - New Home Sales
Wed - Mar 25 - 07:00 - MBA Mortgage Index
Wed - Mar 25 - 08:30 - Durable Orders
Wed - Mar 25 - 10:30 - Crude Oil Inventories
Thu - Mar 26 - 08:30 - Initial Jobless Claims
Thu - Mar 26 - 10:30 - Natural Gas Inventories
Fri - Mar 27 - 08:30 - GDP
Fri - Mar 27 - 10:00 - Michigan Sentiment
This commentary is designed to stimulate thinking. This analysis is not a recommendation to buy, sell, hold or sell short any security (stock ETF or otherwise). We all need to think for ourselves when it comes to trading our own accounts. First, it is the only way to really learn. Second, we are the only ones responsible for our decisions. Think of these charts as food for further analysis. Before making a trade, it is important to have a plan. Plan the trade and trade the plan. Among other things, this includes setting a trigger level, a target area and a stop-loss level. It is also important to plan for three possible price movements: advance, decline or sideways. Have a plan for all three scenarios BEFORE making the trade. Consider possible holding times. And finally, look at overall market conditions and sector/industry performance.


