Stocks were hit with selling pressure on Wednesday with small-caps leading the way. IWM and IJR lost around 1.1% on the day and have been underperforming since early April. Eight of the nine sectors were down with consumer discretionary, consumer staples and healthcare leading lower. The Equal-Weight Consumer Discretionary ETF was hit with weakness in the Home Construction iShares (-1.4%) and the Retail SPDR (-1.94%). Relative weakness in these three is not a good sign for the broader market. Elsewhere, the Regional Bank SPDR (KRE) and the Broker-Dealer iShares (IAI) bucked the selling pressure and rose. Looks like these two like rising Treasury yields. REITs do not as the REIT iShares (IYR) fell around 2%.
**This chart analysis is for educational purposes only, and should not
be construed as a recommendation to buy, sell or sell-short said securities**
Short-term Overview (Thursday, 30-April-2015):
- Short-term breadth indicators are now split: AD Percent is bearish and AD Volume Percent is bullish.
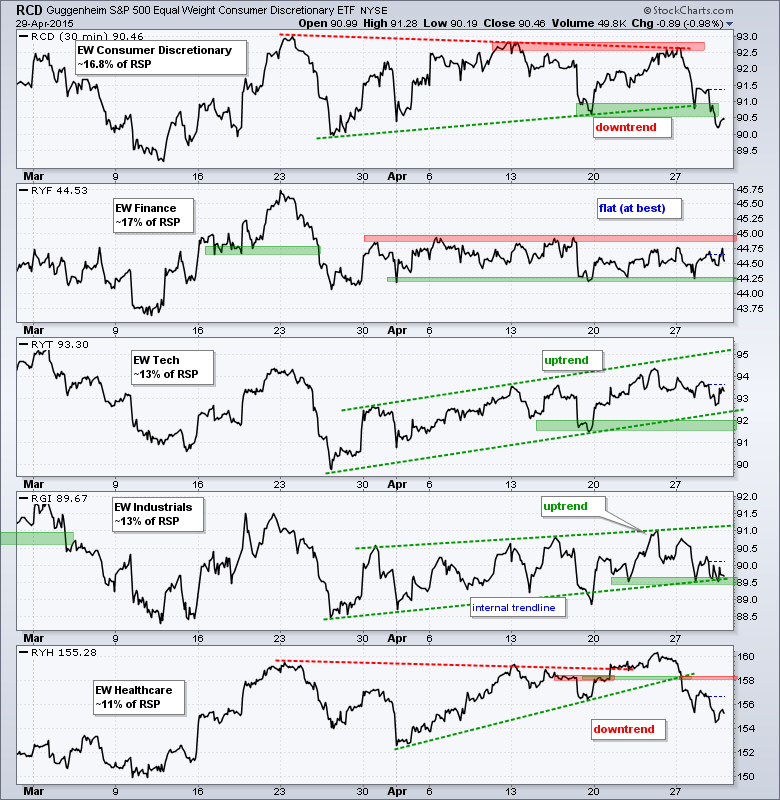
- The sectors are mixed with two in uptrends, two in downtrends and one flat.
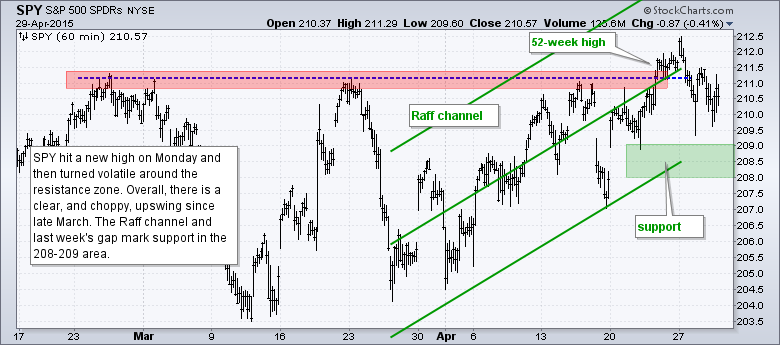
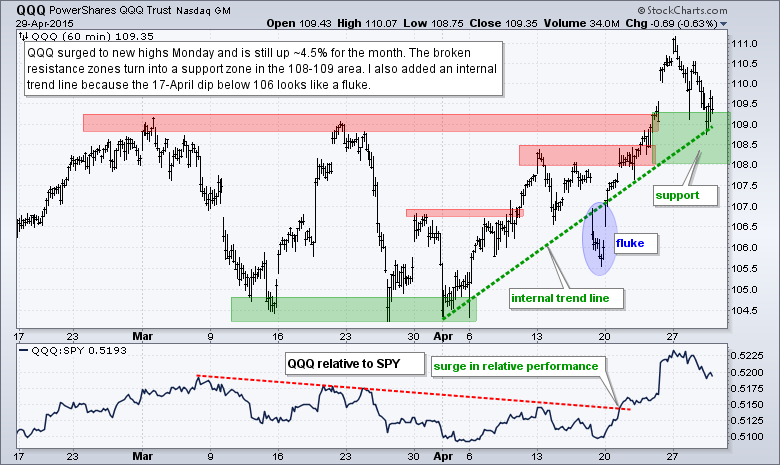
- SPY and QQQ pulled back from their new highs, but remain in short-term uptrends.
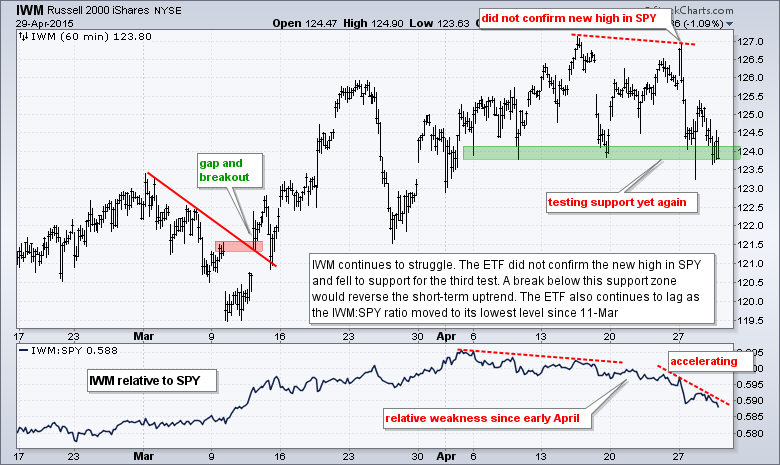
- IWM continues to show relative weakness and is testing support again.
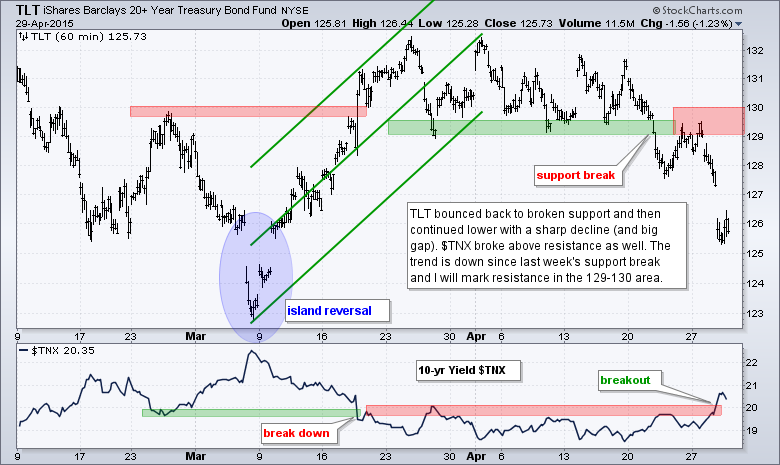
- TLT extended its downtrend with a sharp decline.
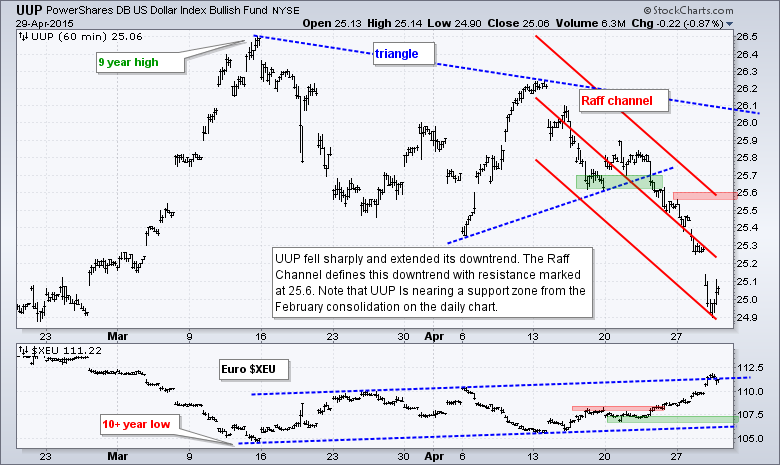
- UUP extended its downtrend with a sharp decline.
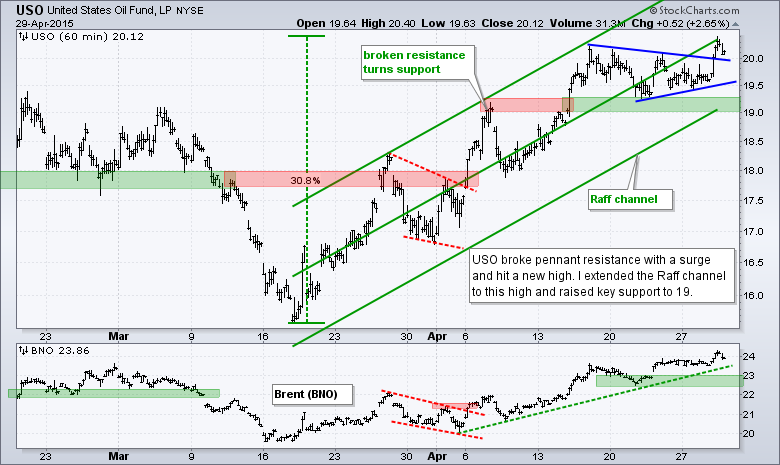
- USO broke pennant resistance and I raised key support.
- GLD fell back to the breakout zone for its first test.
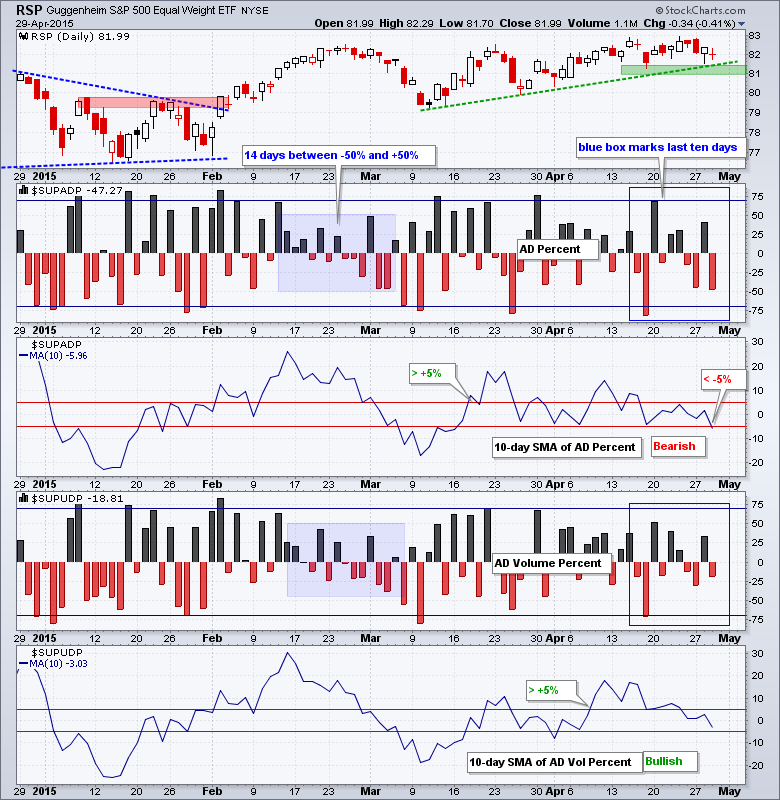
The Equal-Weight S&P 500 ETF (RSP) stalled with a doji just above support. The overall trend remains up with support marked in the 81-81.5 area. AD Percent dipped to -47% and the 10-day SMA for AD Percent moved below -5% to turn short-term bearish. This negates the bullish signal that triggered way back in mid March. AD Volume Percent finished at -19% and the 10-day SMA remains above -5%, though just barely.
The equal-weight sectors remain mixed, but we saw a breakdown in the Equal-Weight Consumer Discretionary ETF (RCD). This means two are in downtrends, two are in uptrends and one is flat. The Equal-weight Technology ETF (RYT) is the only sector holding a strong uptrend. The Equal-weight Finance ETF (RYF) is flat as a pancake and could go either way. The Equal-weight Industrials ETF (RGI) is testing uptrend support.
**************************************************************
**************************************************************
**************************************************************
**************************************************************
**************************************************************
**************************************************************

**************************************************************
***************************************************************
Key Reports and Events (all times Eastern):
Thu - Apr 30 - 08:30 - Initial Jobless Claims
Thu - Apr 30 - 08:30 - PCE Prices
Thu - Apr 30 - 08:30 - Personal Income & Personal Spending
Thu - Apr 30 - 09:45 - Chicago PMI
Thu - Apr 30 - 10:30 - Natural Gas Inventories
Fri - May 01 - 08:15 - ADP Employment Report
Fri - May 01 - 10:00 - Construction Spending
Fri - May 01 - 10:00 - ISM Manufacturing Index
Fri - May 01 - 10:00 - Michigan Sentiment
Fri - May 01 - 17:00 - Auto-Truck Sales
This commentary is designed to stimulate thinking. This analysis is not a recommendation to buy, sell, hold or sell short any security (stock ETF or otherwise). We all need to think for ourselves when it comes to trading our own accounts. First, it is the only way to really learn. Second, we are the only ones responsible for our decisions. Think of these charts as food for further analysis. Before making a trade, it is important to have a plan. Plan the trade and trade the plan. Among other things, this includes setting a trigger level, a target area and a stop-loss level. It is also important to plan for three possible price movements: advance, decline or sideways. Have a plan for all three scenarios BEFORE making the trade. Consider possible holding times. And finally, look at overall market conditions and sector/industry performance.


