Stocks finished the day mixed with not a lot going on in the market. QQQ and IWM edged lower, while DIA and SPY edged higher. And I do mean "edged" because the gains and losses were minimal. Energy was the stand out performer in an otherwise lackluster day. Some interest rate sensitive stocks moved higher as the 20+ YR T-Bond ETF (TLT) surged off support and the 10-YR Treasury Yield ($TNX) fell to the 1.9% area. The Home Construction iShares (ITB) was up .71%, the REIT iShares (IYR) gained .21% and the Utilities SPDR (XLU) advanced .50%. These gains were paired because TLT fell back after a strong open. Nevertheless, the trend for TLT is up and the trend for the 10-YR Treasury Yield is down.
**This chart analysis is for educational purposes only, and should not
be construed as a recommendation to buy, sell or sell-short said securities**
Short-term Overview (Tuesday, 15-April-2015):
- Breadth is uninspiring, but bullish overall.
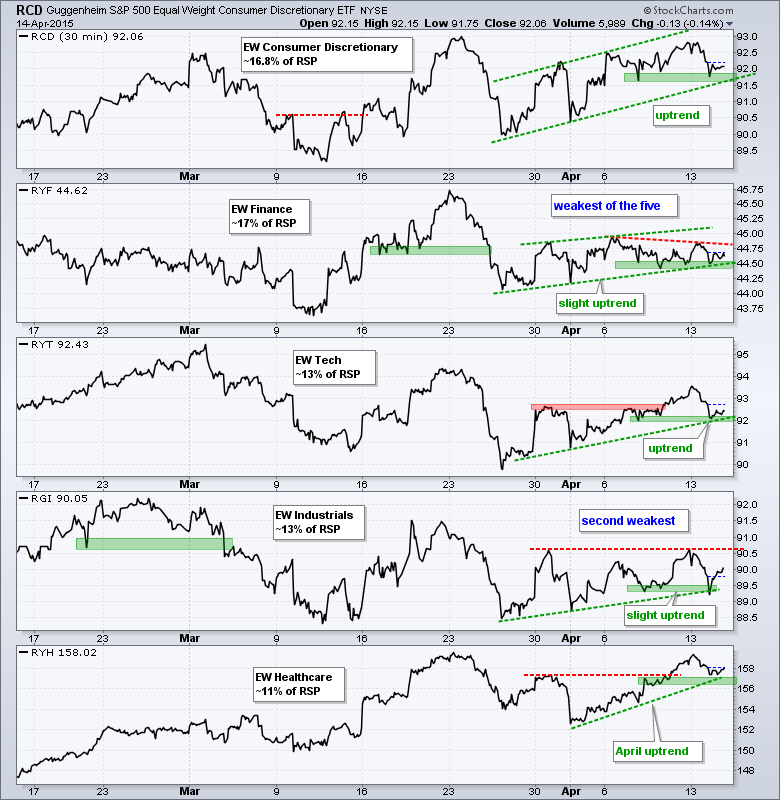
- All five big sectors are in short-term uptrends, but two are looking vulnerable.
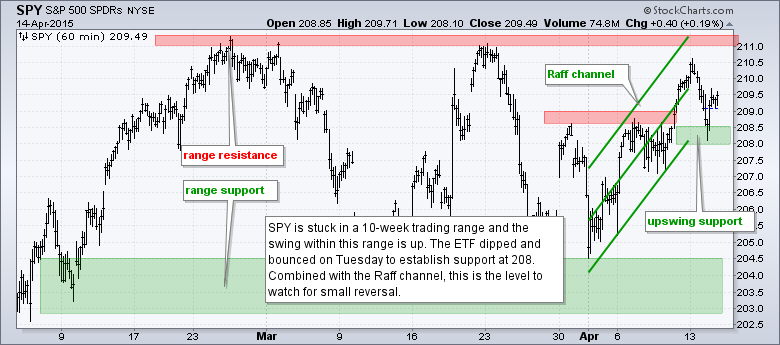
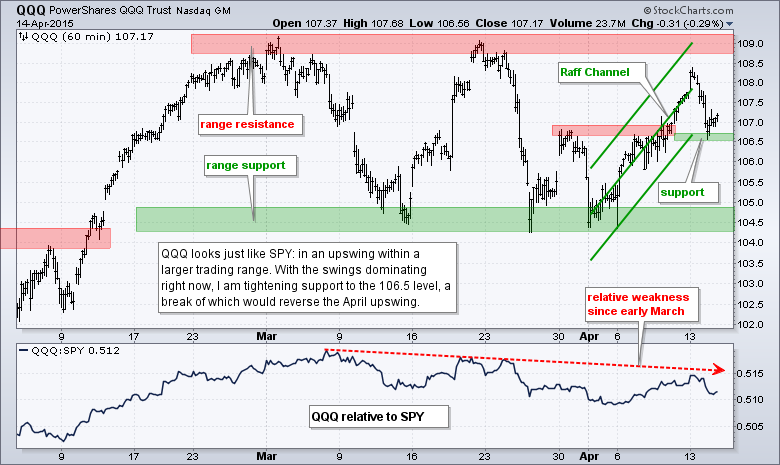
- SPY and QQQ are in upswings within trading ranges and I tightened support.
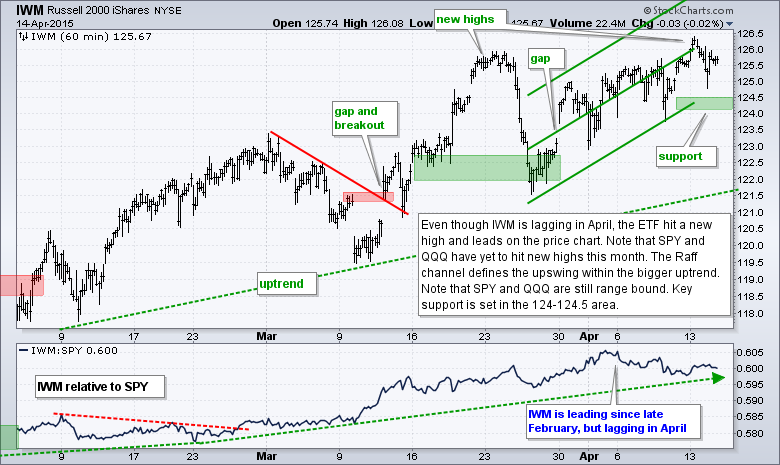
- IWM remains in an uptrend and hit a new high on Monday.
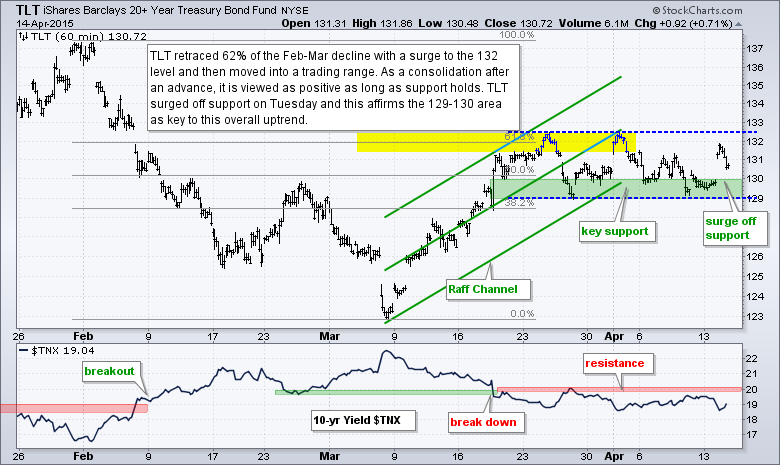
- TLT bounced off support to keep its short-term uptrend alive.
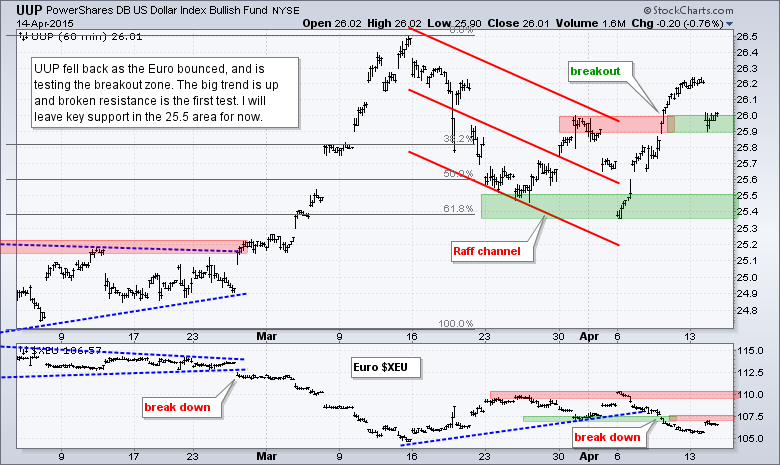
- UUP fell back to its breakout zone for its first test.
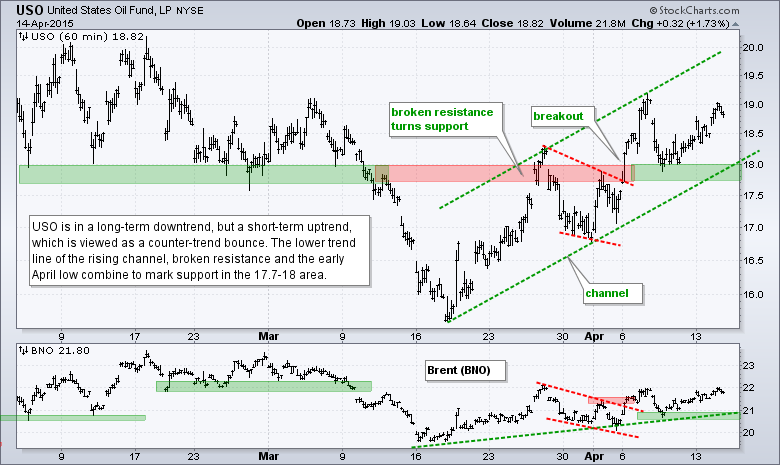
- USO remains in a short-term uptrend, but Spot Crude is hitting range resistance.
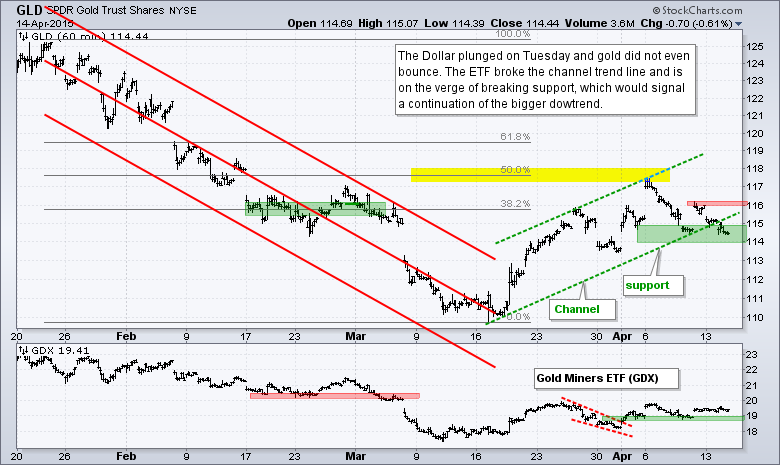
- GLD did not take advantage of Dollar weakness and broke the channel trend line.
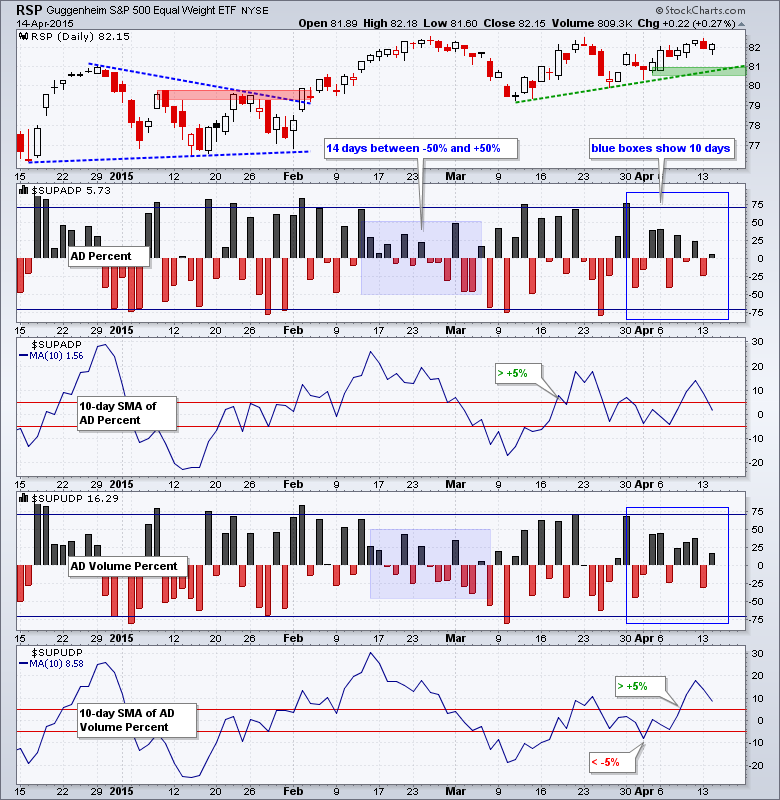
The Equal-Weight S&P 500 ETF (RSP) has stalled out in the 82 area, but the short-term trend is still up with support marked at 80.50. Breadth was uninspiring yet again as AD Percent and AD Volume Percent finished below +25%. These two histograms have been between -50% and +50% the last ten days, which means we have not seen any conviction. The blue shading shows a similar 14 day stretch in February-March. Despite lack of conviction, breadth is short-term bullish until the 10-day SMAs for AD Percent and AD Volume Percent move below -5%.
All five equal-weight sector ETFs are in short-term uptrends, but two are already looking vulnerable. The Equal-Weight Consumer Discretionary ETF (RCD), Equal-weight Technology ETF (RYT) and Equal-weight Healthcare ETF (RYH) are in uptrends. The Equal-weight Finance ETF (RYF) is in a short-term uptrend, but may be forming a lower high this week and a break below the support zone would reverse this uptrend. RYF is clearly the weakest of the five. The Equal-weight Industrials ETF (RGI) got a big bounce on Friday, but fell back sharply and is pretty much in a trading range. It did not exceed its late March high and is the second weakest group.
**************************************************************
**************************************************************
**************************************************************
**************************************************************
**************************************************************
**************************************************************
**************************************************************
***************************************************************
Key Reports and Events (all times Eastern):
Wed - Apr 15 - 07:00 - MBA Mortgage Index
Wed - Apr 15 - 08:30 - Empire State Manufacturing
Wed - Apr 15 - 09:15 - Industrial Production
Wed - Apr 15 - 10:00 - NAHB Housing Market Index
Wed - Apr 15 - 10:30 - Oil Inventories
Wed - Apr 15 - 14:00 - Fed's Beige Book
Thu - Apr 16 - 08:30 - Initial Jobless Claims
Thu - Apr 16 - 08:30 - Housing Starts & Building Permits
Thu - Apr 16 - 10:00 - Philadelphia Fed
Thu - Apr 16 - 10:30 - Natural Gas Inventories
Fri - Apr 17 - 08:30 - Consumer Price Index (CPI)
Fri - Apr 17 - 10:00 - Michigan Sentiment
Fri - Apr 17 - 10:00 - Leading Economic Indicators
Wed - Apr 22 - 07:00 - MBA Mortgage Index
Wed - Apr 22 - 09:00 - FHFA Housing Price Index
Wed - Apr 22 - 10:00 - Existing Home Sales
Wed - Apr 22 - 10:30 - Oil Inventories
Thu - Apr 23 - 08:30 - Initial Jobless Claims
Thu - Apr 23 - 10:00 - New Home Sales
Thu - Apr 23 - 10:30 - Natural Gas Inventories
Fri - Apr 24 - 08:30 - Durable Goods Orders
Tue - Apr 28 - 09:00 - Case-Shiller Housing Index
Tue - Apr 28 - 10:00 - Consumer Confidence
Wed - Apr 29 - 07:00 - MBA Mortgage Purchase Index
Wed - Apr 29 - 10:00 - Pending Home Sales
Wed - Apr 29 - 10:30 - Oil Inventories
Wed - Apr 29 - 14:00 - FOMC Rate Decision
Thu - Apr 30 - 08:30 - Initial Jobless Claims
Thu - Apr 30 - 08:30 - PCE Prices
Thu - Apr 30 - 08:30 - Personal Income & Personal Spending
Thu - Apr 30 - 09:45 - Chicago PMI
Thu - Apr 30 - 10:30 - Natural Gas Inventories
Fri - May 01 - 08:15 - ADP Employment Report
Fri - May 01 - 10:00 - Construction Spending
Fri - May 01 - 10:00 - ISM Manufacturing Index
Fri - May 01 - 10:00 - Michigan Sentiment
Fri - May 01 - 17:00 - Auto-Truck Sales
This commentary is designed to stimulate thinking. This analysis is not a recommendation to buy, sell, hold or sell short any security (stock ETF or otherwise). We all need to think for ourselves when it comes to trading our own accounts. First, it is the only way to really learn. Second, we are the only ones responsible for our decisions. Think of these charts as food for further analysis. Before making a trade, it is important to have a plan. Plan the trade and trade the plan. Among other things, this includes setting a trigger level, a target area and a stop-loss level. It is also important to plan for three possible price movements: advance, decline or sideways. Have a plan for all three scenarios BEFORE making the trade. Consider possible holding times. And finally, look at overall market conditions and sector/industry performance.


