The S&P 500 surged on Friday morning, traded flat the rest of the day and then worked its way lower on Monday. The overall loss (.50%) was modest and this could be just a correction after the Friday surge. The sectors were mostly lower with energy leading the way. There were some bids in healthcare and consumer discretionary though. Banks were fairly strong as the Broker-Dealer iShares (IAI) gained over 1% and the Regional Bank SPDR (KRE) advanced .50%. REITs were hammered again as the 10-YR Treasury Yield ($TNX) surged to 2.274% and hit its highest level of the year. Precious metals were under pressure as gold fell .39%, platinum declined 1.19% and palladium lost 2%.
**This chart analysis is for educational purposes only, and should not
be construed as a recommendation to buy, sell or sell-short said securities**
Short-term Overview (Tuesday, 12-May-2015):
- Short-term breadth indicators are bearish.
- Three equal-weight sectors are in downtrends and two are flat.
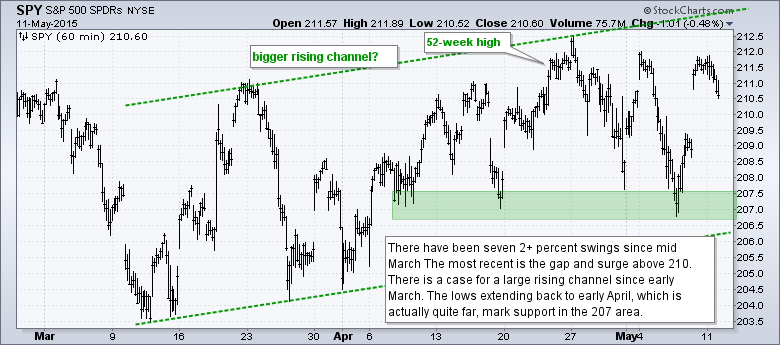
- SPY surged on Friday and held support from the lows extending back to early April.
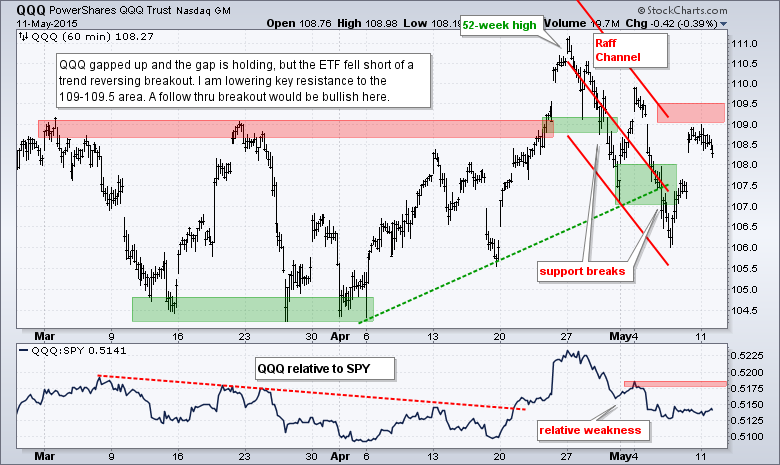
- QQQ surged on Friday, but did not break resistance and remains in a short-term downtrend.
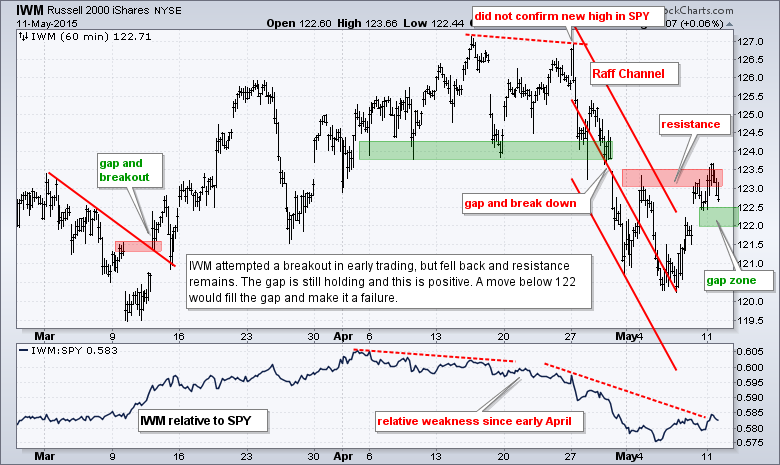
- IWM surged on Friday, stalled at resistance, and remains in a short-term downtrend.
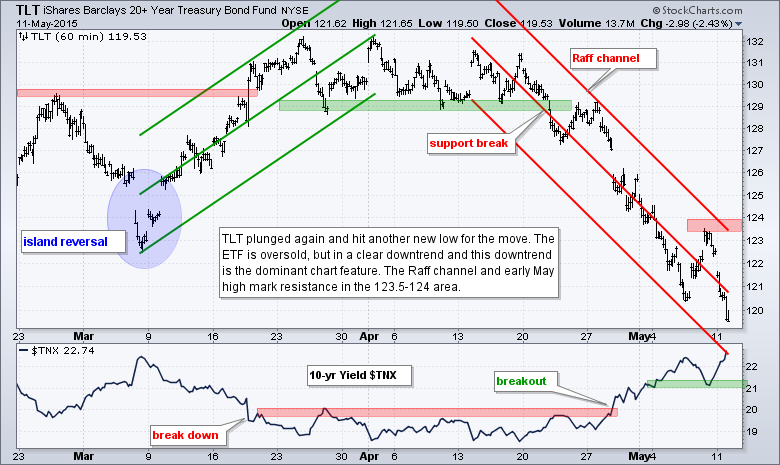
- TLT hit a new low for the move and remains in a short-term downtrend.
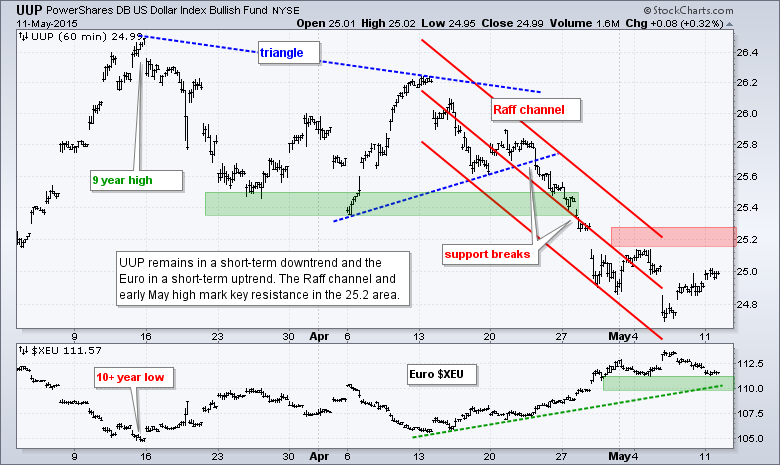
- UUP is firming, but remains in a short-term downtrend.
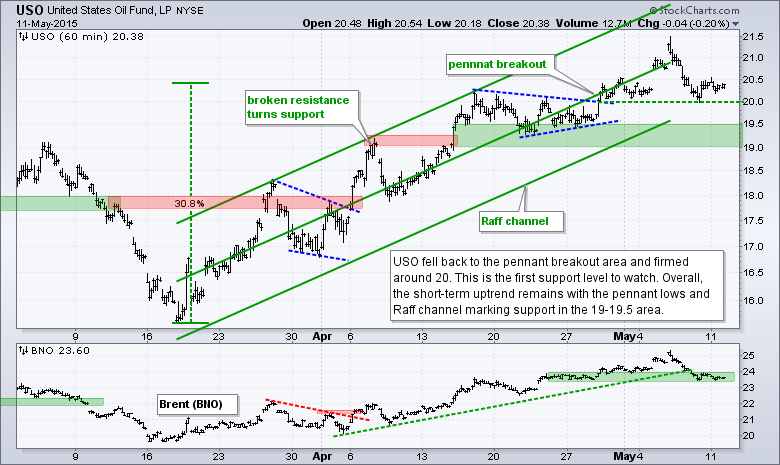
- USO is testing the pennant breakout and remains in a short-term uptrend.
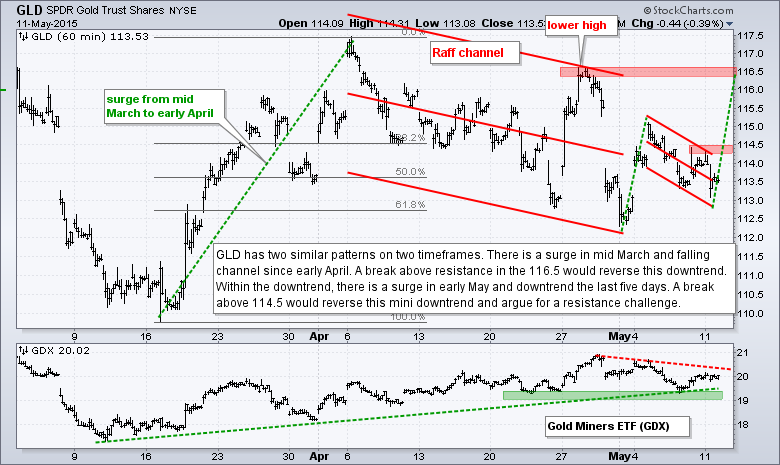
- GLD is in a short-term downtrend and has a smaller flag working within this downtrend.
The Equal-Weight S&P 500 ETF (RSP) surged to the trend line extending down from late April and fell back a little on Monday. The two week trend is down and a follow thru breakout at 82.5 is needed to reverse this downtrend.
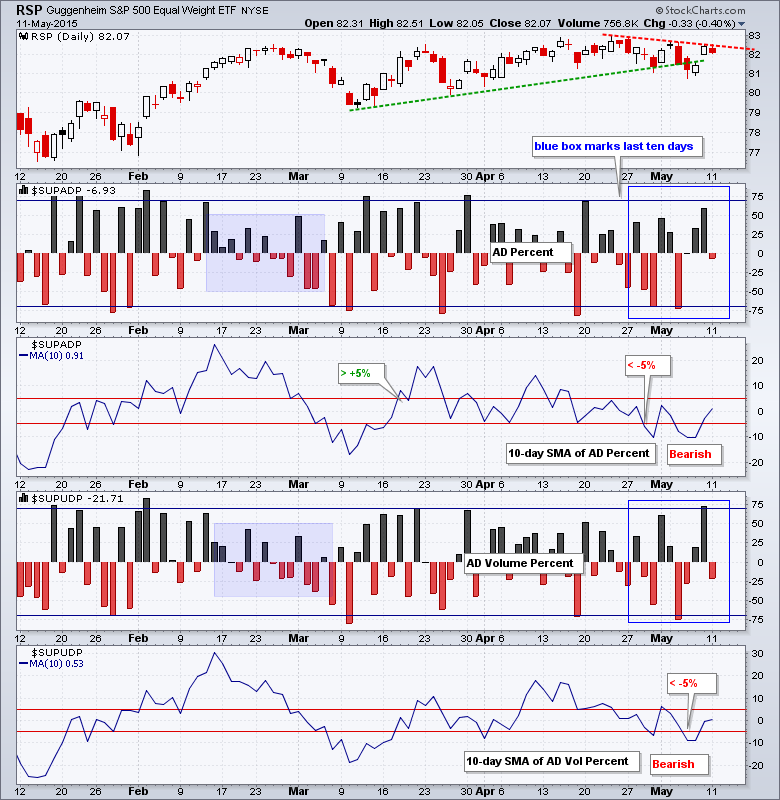
AD Percent and AD Volume Percent were slightly negative on Monday. The 10-day SMA for AD Percent broke below -5% in late April to turn bearish. The 10-day SMA for AD Volume Percent broke below -5% in early May to turn bearish. Both remain bearish until there are counter trend signals with a move above +5%.
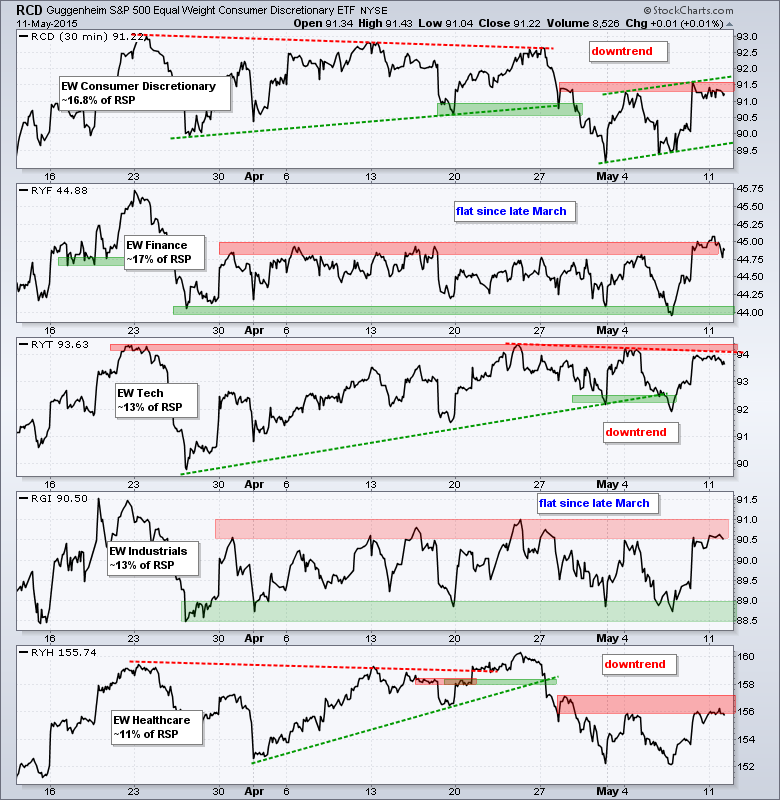
The five equal-weight sector ETFs are tough calls right now and this explains why the broader market is so choppy. I count three in downtrends and two in trading ranges. The Equal-Weight Consumer Discretionary ETF (RCD) broke down in late April and rebounded in May with a zigzag up. The Finance SPDR (XLF) and the Equal-weight Industrials ETF (RGI) have been flat since late March, but both are challenging resistance zones. The Equal-weight Technology ETF (RYT) formed lower highs the last three weeks and remains in a downtrend.
**************************************************************
**************************************************************
**************************************************************
**************************************************************
**************************************************************
**************************************************************
**************************************************************
***************************************************************
Key Reports and Events (all times Eastern):
Tue - May 12 - 00:00 - JOLTS
Wed - May 13 - 07:00 - MBA Mortgage Index
Wed - May 13 - 08:30 - Retail Sales
Wed - May 13 - 10:00 - Business Inventories
Wed - May 13 - 10:30 - Crude Oil Inventories
Thu - May 14 - 08:30 - Initial Jobless Claims
Thu - May 14 - 08:30 - Producer Price Index (PPI)
Thu - May 14 - 10:30 - Natural Gas Inventories
Fri - May 15 - 08:30 - Empire State Manufacturing
Fri - May 15 - 09:15 - Industrial Production
Fri - May 15 - 10:00 - Michigan Sentiment
Mon - May 18 - 10:00 - NAHB Housing Market Index
Tue - May 19 - 08:30 - Housing Starts/Building Permits
Wed - May 20 - 07:00 - MBA Mortgage Index
Wed - May 20 - 10:30 - Crude Oil Inventories
Wed - May 20 - 14:00 - FOMC Minutes
Thu - May 21 - 08:30 - Initial Jobless Claims
Thu - May 21 - 10:00 - Existing Home Sales
Thu - May 21 - 10:00 - Philadelphia Fed
Thu - May 21 - 10:00 - Leading Indicators
Thu - May 21 - 10:30 - Natural Gas Inventories
Fri - May 22 - 08:30 - Consumer Price Index (CPI)
Tue - May 26 - 08:30 - Durable Goods Orders
Tue - May 26 - 09:00 - Case-Shiller 20-city Index
Tue - May 26 - 09:00 - FHFA Housing Price Index
Tue - May 26 - 10:00 - New Home Sales
Tue - May 26 - 10:00 - Consumer Confidence
Wed - May 27 - 07:00 - MBA Mortgage Index
Thu - May 28 - 08:30 - Initial Jobless Claims
Thu - May 28 - 10:00 - Pending Home Sales
Thu - May 28 - 10:30 - Natural Gas Inventories
Thu - May 28 - 11:00 - Crude Oil Inventories
Fri - May 29 - 08:30 - GDP
Fri - May 29 - 09:45 - Chicago PMI
Fri - May 29 - 10:00 - Michigan Sentiment
This commentary is designed to stimulate thinking. This analysis is not a recommendation to buy, sell, hold or sell short any security (stock ETF or otherwise). We all need to think for ourselves when it comes to trading our own accounts. First, it is the only way to really learn. Second, we are the only ones responsible for our decisions. Think of these charts as food for further analysis. Before making a trade, it is important to have a plan. Plan the trade and trade the plan. Among other things, this includes setting a trigger level, a target area and a stop-loss level. It is also important to plan for three possible price movements: advance, decline or sideways. Have a plan for all three scenarios BEFORE making the trade. Consider possible holding times. And finally, look at overall market conditions and sector/industry performance.


