Let the choppiness begin. Or rather, let the choppiness continue. Stocks started flat, moved lower around noon and then bounced in the final hour. The major index ETFs still finished down on the day, but the declines were fractional and they managed to close off their lows. Even so, note that the S&P 500 has been locked in a 5% range since March. Energy once again weighed as oil fell sharply. The utilities and consumer staples SPDRs bucked the selling pressure and closed fractionally higher. Airlines also bucked the selling pressure as the Airline ETF (JETS) gained over 2% and the Leisure and Entertainment ETF (PEJ) advanced over 1%. Note that four of the top ten holdings are airlines. As noted in Monday's Don't Ignore this Chart post, the airline SCTRs also popped and Delta (DAL) looks the strongest.
**This chart analysis is for educational purposes only, and should not
be construed as a recommendation to buy, sell orsell-short said securities**
Short-term Overview (Tuesday, 4-August-2015):
- Short-term breadth is bearish overall.
- The five sector ETFs are split: two up, two down and one flat.
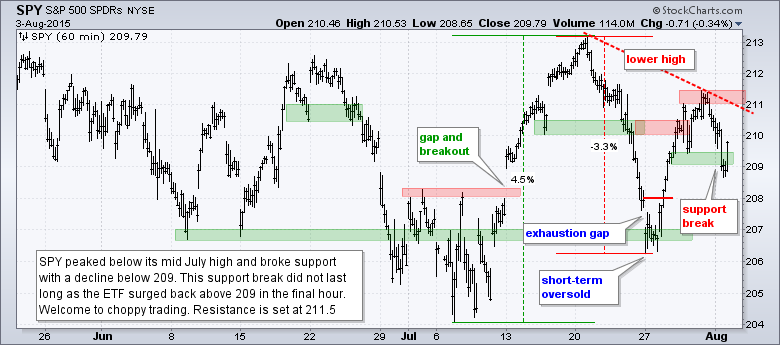
- SPY formed a lower high and broke support.
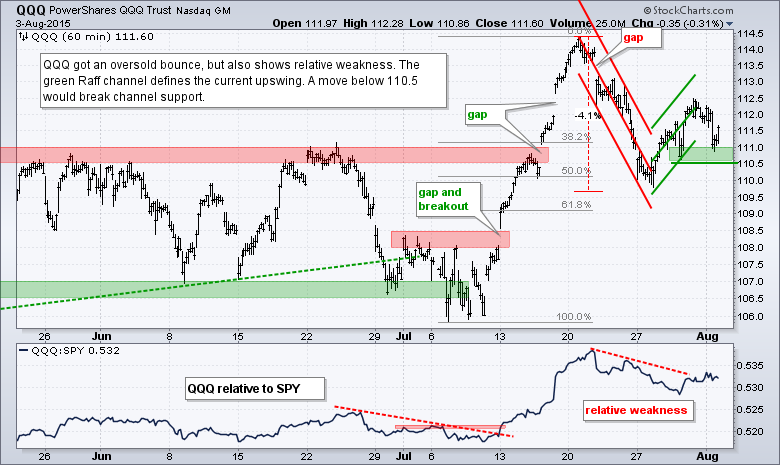
- QQQ shows relative weakness, but remains in an upswing.
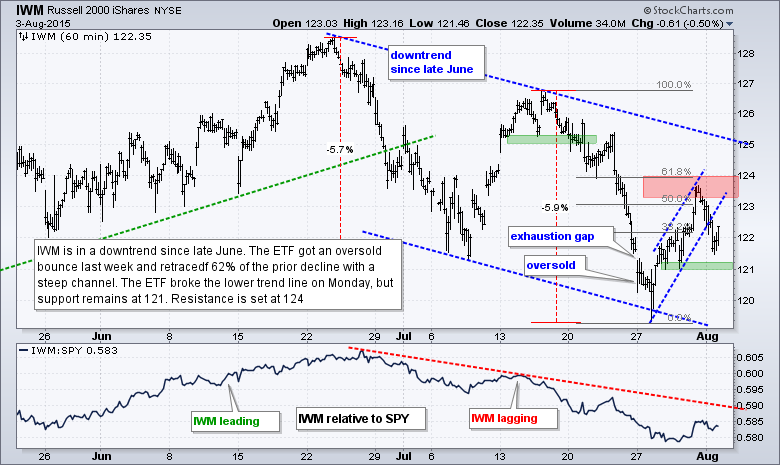
- IWM got a weak oversold bounce and shows relative weakness.
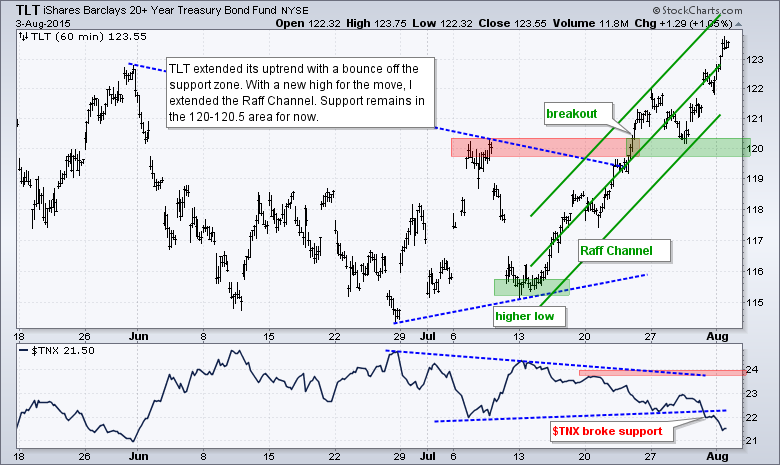
- TLT bounced off support to extend its short-term uptrend.
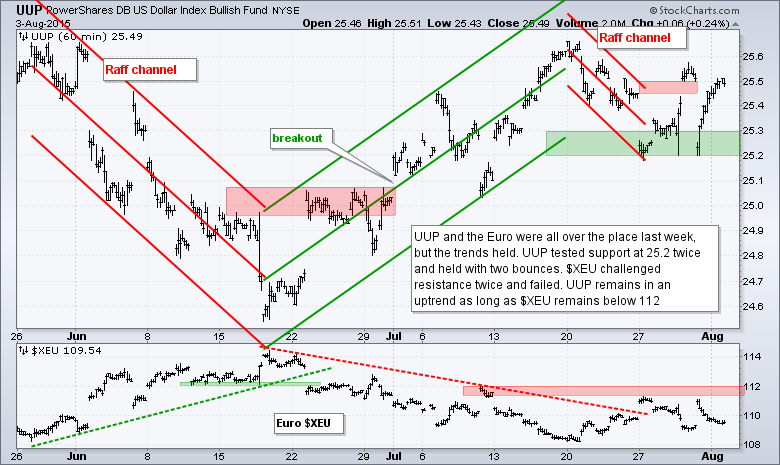
- UUP has become choppy, but remains in an uptrend overall.
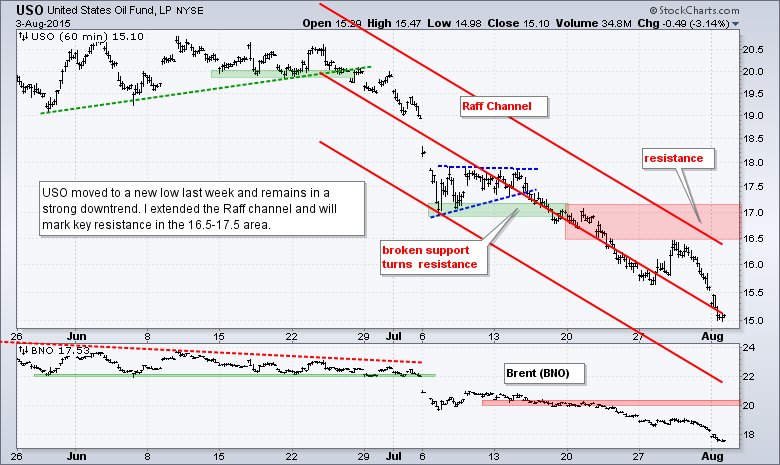
- USO is in a short-term downtrend.
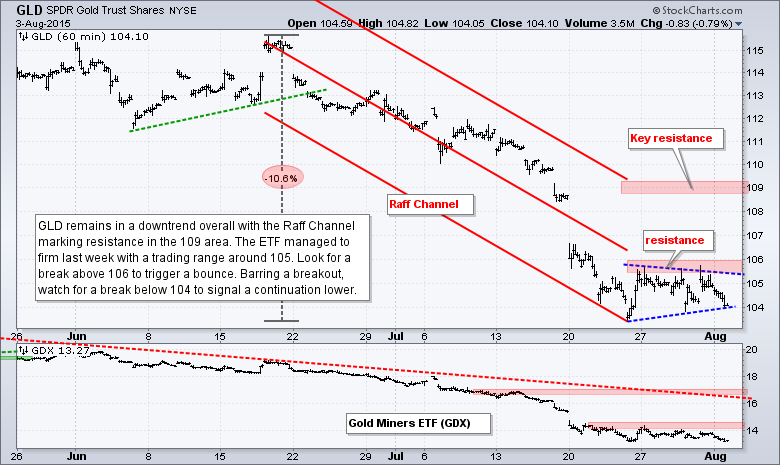
- GLD is in a short-term downtrend.
I remain focused on the six day upswing. Overall, RSP formed lower highs and lower lows in June and July. The current bounce was from a lower low and the ETF is in the middle of its four month range. This means RSP is in a four-month trading range at best and a two month downtrend at worst. The Raff Regression Channel and Wednesday's low define the current upswing with support marked at 79.8. A close below this level would reverse the upswing.
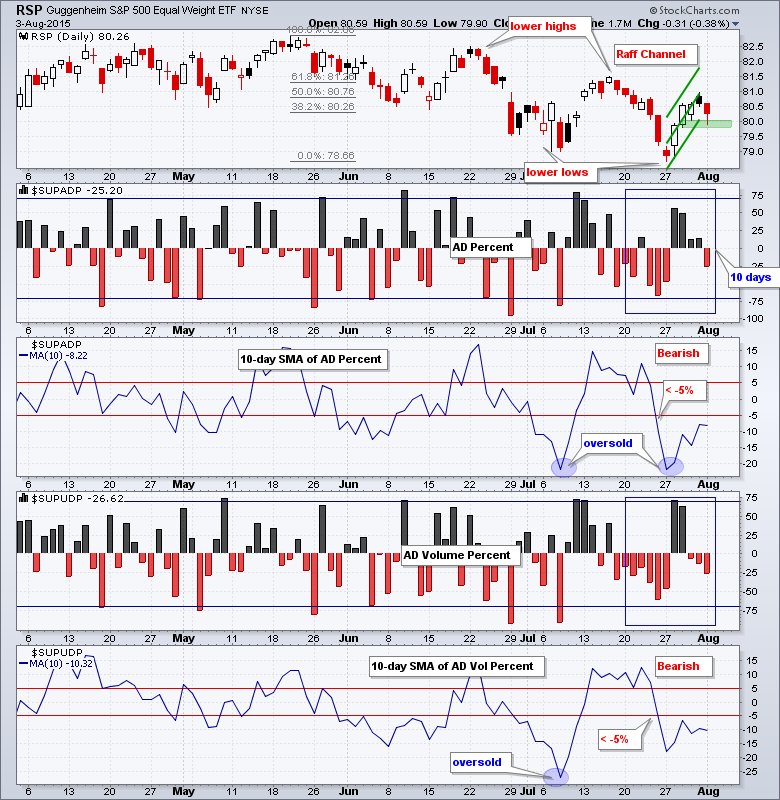
AD Percent and AD Volume Percent finished modestly negative on Monday. Breadth is bearish overall because both 10-day SMAs remain in negative territory. Both 10-day SMAs remain below -5%.
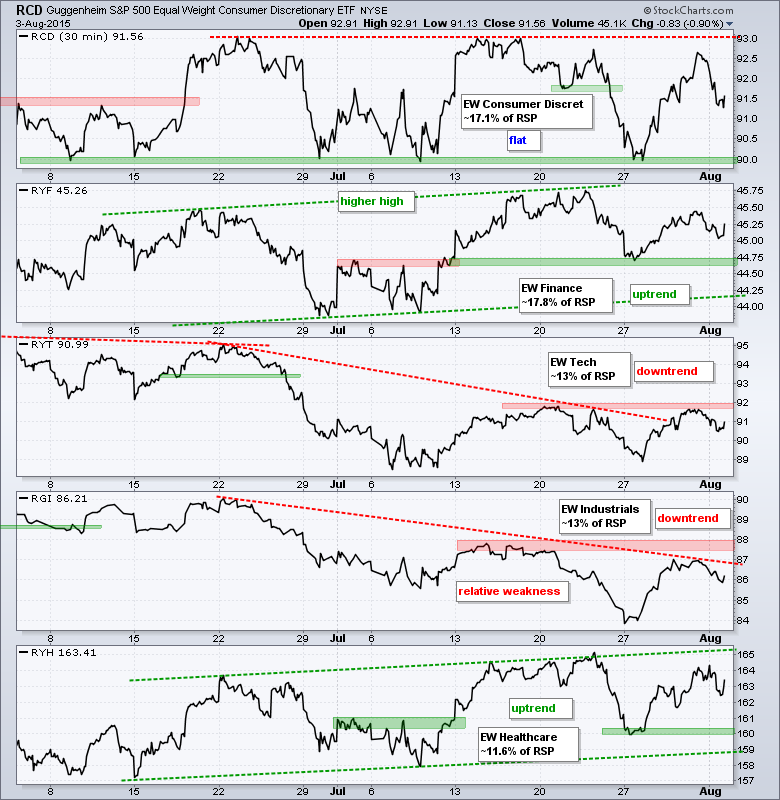
No change. The equal-weight sector ETFs are split: two in uptrends, two in downtrends and one flat. The Equal-Weight Consumer Discretionary ETF (RCD) got a strong bounce off support last week and fell back on Monday. The ETF remains range bound overall. The Equal-weight Finance ETF (RYF) and Equal-weight Healthcare ETF (RYH) remain in uptrends and are leaders overall. The Equal-weight Technology ETF (RYT) held its early June lows and bounced towards resistance. The Equal-weight Industrials ETF (RGI) got a big oversold bounce, but remains below resistance.
**************************************************************
**************************************************************
**************************************************************
**************************************************************
**************************************************************
**************************************************************
**************************************************************
***************************************************************
Key Reports and Events (all times Eastern):
Tue - Aug 04 - 10:00 - Factory Orders
Wed - Aug 05 - 07:00 - MBA Mortgage Index
Wed - Aug 05 - 08:15 - ADP Employment Report
Wed - Aug 05 - 10:00 - ISM Services
Wed - Aug 05 - 10:30 - Crude Oil Inventories
Thu - Aug 06 - 07:30 - Challenger Job Report
Thu - Aug 06 - 08:30 - Initial Jobless Claims
Thu - Aug 06 - 10:30 - Natural Gas Inventories
Fri - Aug 07 - 08:30 - Employment Report
Wed - Aug 12 - 07:00 - MBA Mortgage Index
Wed - Aug 12 - 10:00 - JOLTS Jobs Report
Wed - Aug 12 - 10:30 - Crude Oil Inventories
Wed - Aug 12 - 14:00 - Treasury Budget
Thu - Aug 13 - 08:30 - Initial Jobless Claims
Thu - Aug 13 - 08:30 - Retail Sales
Thu - Aug 13 - 10:00 - Business Inventories
Thu - Aug 13 - 10:30 - Natural Gas Inventories
Fri - Aug 14 - 08:30 - Producer Price Index (PPI)
Fri - Aug 14 - 09:15 - Industrial Production
Fri - Aug 14 - 10:00 - Michigan Sentiment
Mon - Aug 17 - 08:30 - Empire Manufacturing
Mon - Aug 17 - 10:00 - NAHB Housing Market Index
Tue - Aug 18 - 08:30 - Housing Starts/Building Permits
Wed - Aug 19 - 07:00 - MBA Mortgage Index
Wed - Aug 19 - 08:30 - Consumer Price Index (CPI)
Wed - Aug 19 - 10:30 - Crude Oil Inventories
Wed - Aug 19 - 14:00 - FOMC Minutes
Thu - Aug 20 - 08:30 - Initial Jobless Claims
Thu - Aug 20 - 10:00 - Existing Home Sales
Thu - Aug 20 - 10:00 - Philadelphia Fed
Thu - Aug 20 - 10:00 - Leading Indicators
Thu - Aug 20 - 10:30 - Natural Gas Inventories
Tue - Aug 25 - 09:00 - Case-Shiller Housing Index
Tue - Aug 25 - 09:00 - FHFA Housing Price Index
Tue - Aug 25 - 10:00 - New Home Sales
Tue - Aug 25 - 10:00 - Consumer Confidence
Wed - Aug 26 - 07:00 - MBA Mortgage Index
Wed - Aug 26 - 08:30 - Durable Goods Orders
Wed - Aug 26 - 10:30 - Crude Oil Inventories
Thu - Aug 27 - 08:30 - Initial Jobless Claims
Thu - Aug 27 - 08:30 - GDP
Thu - Aug 27 - 10:00 - Pending Home Sales
Thu - Aug 27 - 10:30 - Natural Gas Inventories
Fri - Aug 28 - 08:30 - Personal Income & Spending
Fri - Aug 28 - 08:30 - PCE Prices
Fri - Aug 28 - 10:00 - Michigan Sentiment
Mon - Aug 31 - 09:45 - Chicago PMI
Tue - Sep 01 - 10:00 - Construction Spending
Tue - Sep 01 - 10:00 - ISM Manufacturing Index
Tue - Sep 01 - 17:00 - Auto/Truck Sales
Wed - Sep 02 - 07:00 - MBA Mortgage Purchase Index
Wed - Sep 02 - 08:15 - ADP Employment Report
Wed - Sep 02 - 10:00 - Factory Orders
Wed - Sep 02 - 10:30 - Crude Oil Inventories
Wed - Sep 02 - 14:00 - Fed's Beige Book
Thu - Sep 03 - 07:30 - Challenger Job Report
Thu - Sep 03 - 08:30 - Initial Jobless Claims
Thu - Sep 03 - 10:00 - ISM Services
Thu - Sep 03 - 10:30 - Natural Gas Inventories
Fri - Sep 04 - 08:30 - Employment Report
This commentary is designed to stimulate thinking. This analysis is not a recommendation to buy, sell, hold or sell short any security (stock ETF or otherwise). We all need to think for ourselves when it comes to trading our own accounts. First, it is the only way to really learn. Second, we are the only ones responsible for our decisions. Think of these charts as food for further analysis. Before making a trade, it is important to have a plan. Plan the trade and trade the plan. Among other things, this includes setting a trigger level, a target area and a stop-loss level. It is also important to plan for three possible price movements: advance, decline or sideways. Have a plan for all three scenarios BEFORE making the trade. Consider possible holding times. And finally, look at overall market conditions and sector/industry performance.


