Stocks started the day under selling pressure as the S&P 500 fell around 1.5% in the first hour trading. The buyers then stepped in and pushed the index above its prior close for a small gain. The big hammer candlestick formed as a result. While this intraday reversal is impressive, the short-term trend remains down for SPY and QQQ. Follow through is needed to turn this intraday reversal into a short-term trend reversal. Energy and utilities led in the beginning and at the end with 1+ percent gains in their sector SPDRs. Note that the Networking iShares (IGN) and Semiconductor SPDR (XSD) closed positive to show some upside leadership.
**This chart analysis is for educational purposes only, and should not
be construed as a recommendation to buy, sell or sell-short said securities**
Programming Note: There will be a change in Art's Charts next week. In short, I need to stop with the intraday short-term analysis that tries to catch every twist and turn in the markets. The bigger trends really matter and this is where I want to focus. Starting next week, Art's Charts will be published on Tuesday and Thursday. I will cover the major index ETFs, sectors, breadth, industry group ETFs, gold, oil, bonds and individual stocks.
Short-term Overview (Thursday, 13-August-2015):
- Short-term breadth is mixed.
- Three of the five EW sector ETFs are in downtrends.
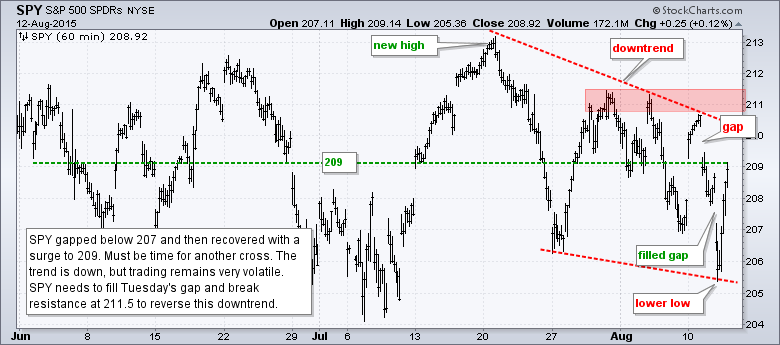
- SPY is in a downtrend with lower lows and lower highs.
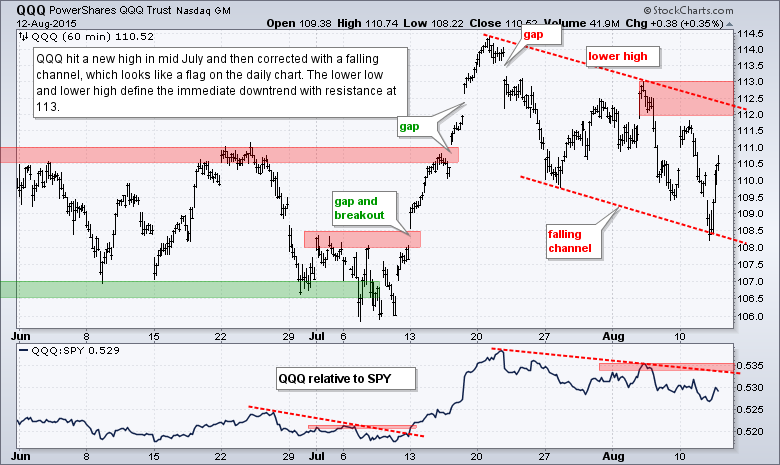
- QQQ formed a lower low and remains within a falling channel.
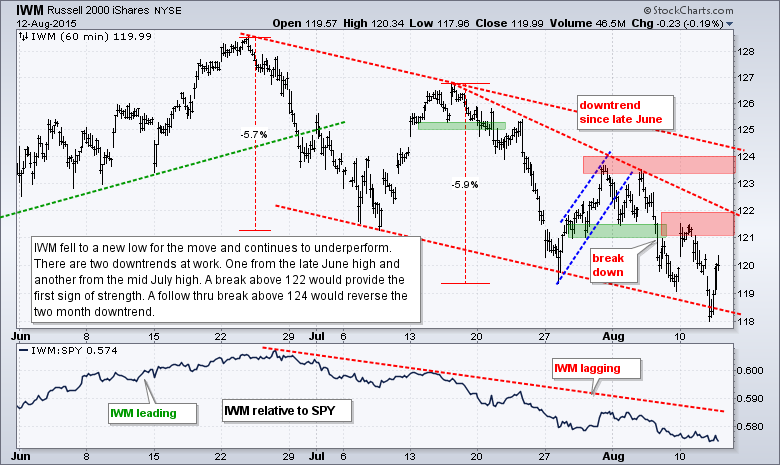
- IWM remains relatively weak and in a short-term downtrend.
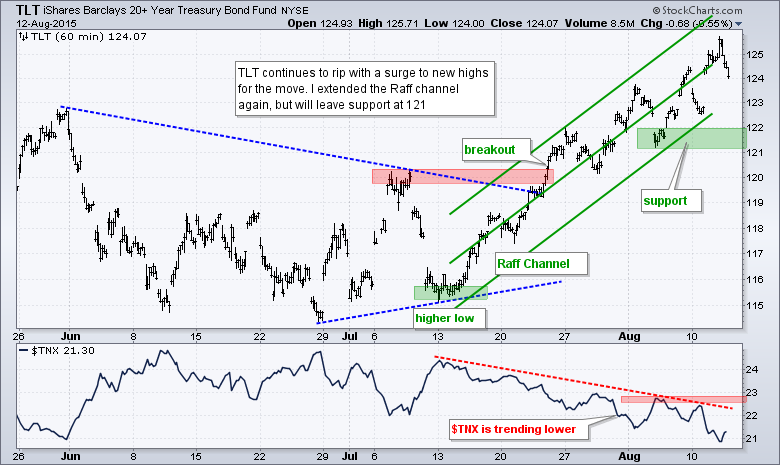
- TLT remains in an uptrend.
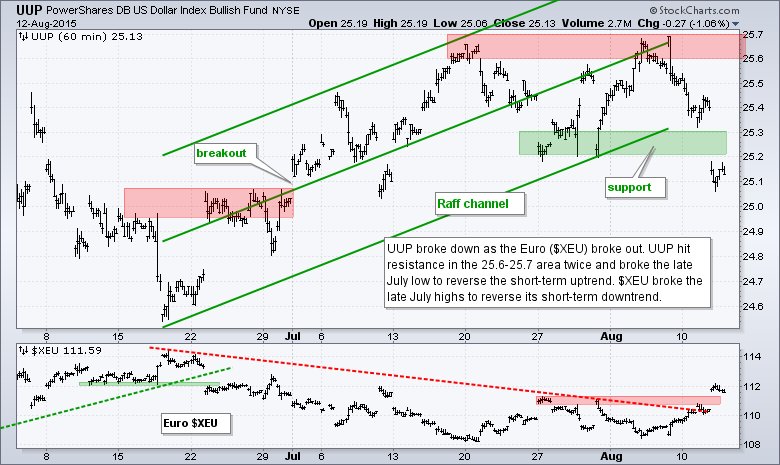
- UUP broke support to reverse its short-term uptrend.
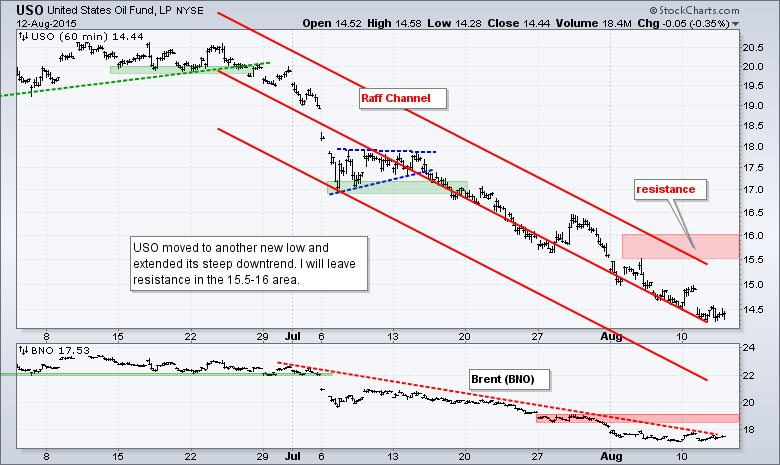
- USO fell to new lows and extended its downtrend.
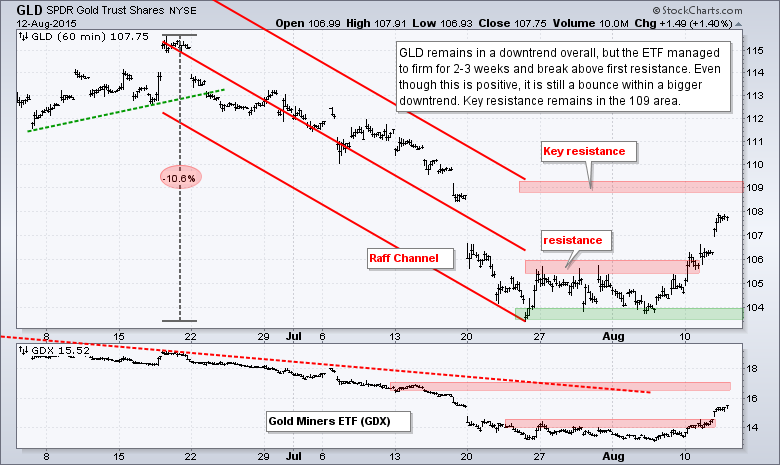
- GLD firmed for a few weeks and broke first resistance.
RSP moved below support in early trading and then surged to close above support, and near the high of the day. Obviously, this affirms support in the 79.5 area - on a closing basis. The downtrend since June remains with lower highs and a breakout at 81 is needed to reverse this slide.
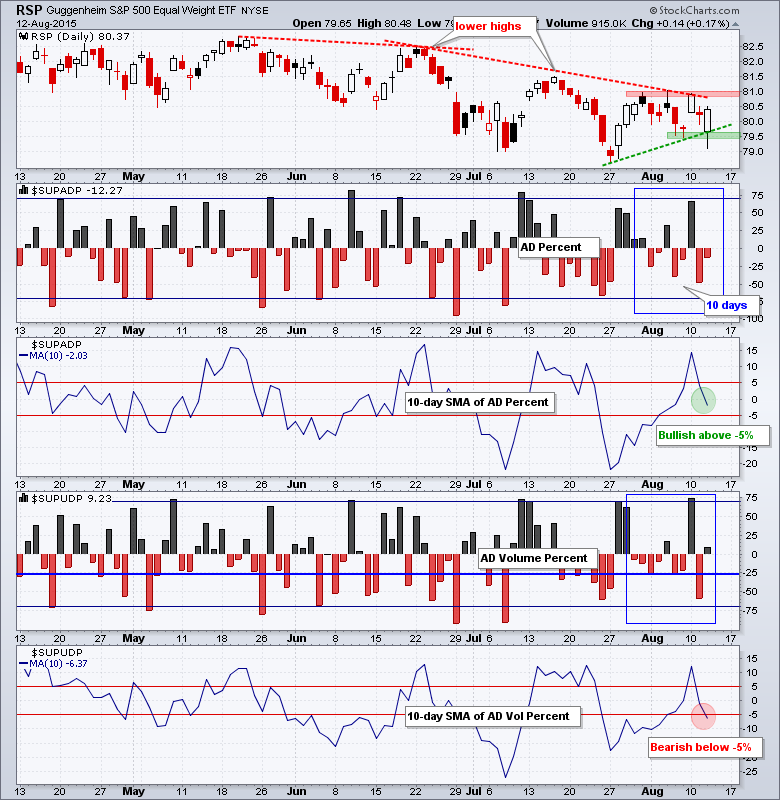
AD Percent finished slightly negative and AD Volume Percent finished slightly positive. In an interesting twist, the 10-day SMA for AD Percent remains above -5% and net bullish. The 10-day EMA for AD Volume Percent fell below -5% and is net bearish. This gives a slight edge to small and mid caps because small and mid caps are the main drivers for AD Percent.
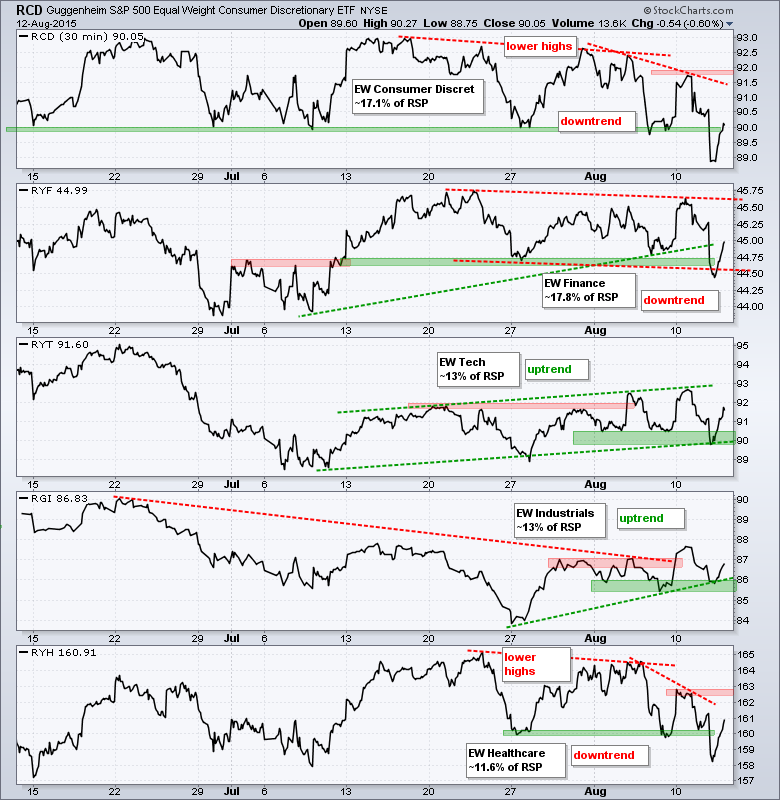
Three of the five equal-weight sector ETFs are in short-term uptrends. Consumer discretionary formed lower highs and broke its July low. Finance formed a lower high in early August and broke its late July low. Healthcare formed a lower high and broke its late July low. Even though these three rebounded, I would like to see follow through breakouts to start uptrends. Technology and industrials remain in uptrends because they held support and have higher highs working.
**************************************************************
**************************************************************
**************************************************************
**************************************************************
**************************************************************
**************************************************************
**************************************************************
***************************************************************
Key Reports and Events (all times Eastern):
Thu - Aug 13 - 08:30 - Initial Jobless Claims
Thu - Aug 13 - 08:30 - Retail Sales
Thu - Aug 13 - 10:00 - Business Inventories
Thu - Aug 13 - 10:30 - Natural Gas Inventories
Fri - Aug 14 - 08:30 - Producer Price Index (PPI)
Fri - Aug 14 - 09:15 - Industrial Production
Fri - Aug 14 - 10:00 - Michigan Sentiment
Mon - Aug 17 - 08:30 - Empire Manufacturing
Mon - Aug 17 - 10:00 - NAHB Housing Market Index
Tue - Aug 18 - 08:30 - Housing Starts/Building Permits
Wed - Aug 19 - 07:00 - MBA Mortgage Index
Wed - Aug 19 - 08:30 - Consumer Price Index (CPI)
Wed - Aug 19 - 10:30 - Crude Oil Inventories
Wed - Aug 19 - 14:00 - FOMC Minutes
Thu - Aug 20 - 08:30 - Initial Jobless Claims
Thu - Aug 20 - 10:00 - Existing Home Sales
Thu - Aug 20 - 10:00 - Philadelphia Fed
Thu - Aug 20 - 10:00 - Leading Indicators
Thu - Aug 20 - 10:30 - Natural Gas Inventories
Tue - Aug 25 - 09:00 - Case-Shiller Housing Index
Tue - Aug 25 - 09:00 - FHFA Housing Price Index
Tue - Aug 25 - 10:00 - New Home Sales
Tue - Aug 25 - 10:00 - Consumer Confidence
Wed - Aug 26 - 07:00 - MBA Mortgage Index
Wed - Aug 26 - 08:30 - Durable Goods Orders
Wed - Aug 26 - 10:30 - Crude Oil Inventories
Thu - Aug 27 - 08:30 - Initial Jobless Claims
Thu - Aug 27 - 08:30 - GDP
Thu - Aug 27 - 10:00 - Pending Home Sales
Thu - Aug 27 - 10:30 - Natural Gas Inventories
Fri - Aug 28 - 08:30 - Personal Income & Spending
Fri - Aug 28 - 08:30 - PCE Prices
Fri - Aug 28 - 10:00 - Michigan Sentiment
Mon - Aug 31 - 09:45 - Chicago PMI
Tue - Sep 01 - 10:00 - Construction Spending
Tue - Sep 01 - 10:00 - ISM Manufacturing Index
Tue - Sep 01 - 17:00 - Auto/Truck Sales
Wed - Sep 02 - 07:00 - MBA Mortgage Purchase Index
Wed - Sep 02 - 08:15 - ADP Employment Report
Wed - Sep 02 - 10:00 - Factory Orders
Wed - Sep 02 - 10:30 - Crude Oil Inventories
Wed - Sep 02 - 14:00 - Fed's Beige Book
Thu - Sep 03 - 07:30 - Challenger Job Report
Thu - Sep 03 - 08:30 - Initial Jobless Claims
Thu - Sep 03 - 10:00 - ISM Services
Thu - Sep 03 - 10:30 - Natural Gas Inventories
Fri - Sep 04 - 08:30 - Employment Report
This commentary is designed to stimulate thinking. This analysis is not a recommendation to buy, sell, hold or sell short any security (stock ETF or otherwise). We all need to think for ourselves when it comes to trading our own accounts. First, it is the only way to really learn. Second, we are the only ones responsible for our decisions. Think of these charts as food for further analysis. Before making a trade, it is important to have a plan. Plan the trade and trade the plan. Among other things, this includes setting a trigger level, a target area and a stop-loss level. It is also important to plan for three possible price movements: advance, decline or sideways. Have a plan for all three scenarios BEFORE making the trade. Consider possible holding times. And finally, look at overall market conditions and sector/industry performance.


