Medium-term Evidence Remains Bearish
Video will be posted around 11AM ET. The bulk of the medium-term evidence remains bearish for the stock market as a whole. I noted that a bullish breadth thrust occurred on Thursday. This thrust, however, was not confirmed by other breadth indicators - namely High-Low Percent. Overall, the AD Lines and AD Volume Lines for the major indices remain in downtrends and the 10-day EMAs for High-Low Percent remain below +3%. The bullish breadth thrust in October, in contrast, was accompanied by a surge in new highs and the high-low indicator exceeded +3% in late October.
We can sum up broad market breadth by looking at the key indicators for the S&P 1500. Notice that the S&P 1500 AD Line ($SUPADP) broke down on July 28th, the S&P 1500 AD Volume Percent ($SUPUDP) broke down on June 29th and the 10-day EMA of High-Low Percent broke below -3% on August 21st. The S&P 1500 also broke down on August 21st. The breadth indicators were net bearish at the end of July. The High-Low indicator and the S&P 1500 followed suit with break downs on August 21st. These bearish signals have yet to be reversed.
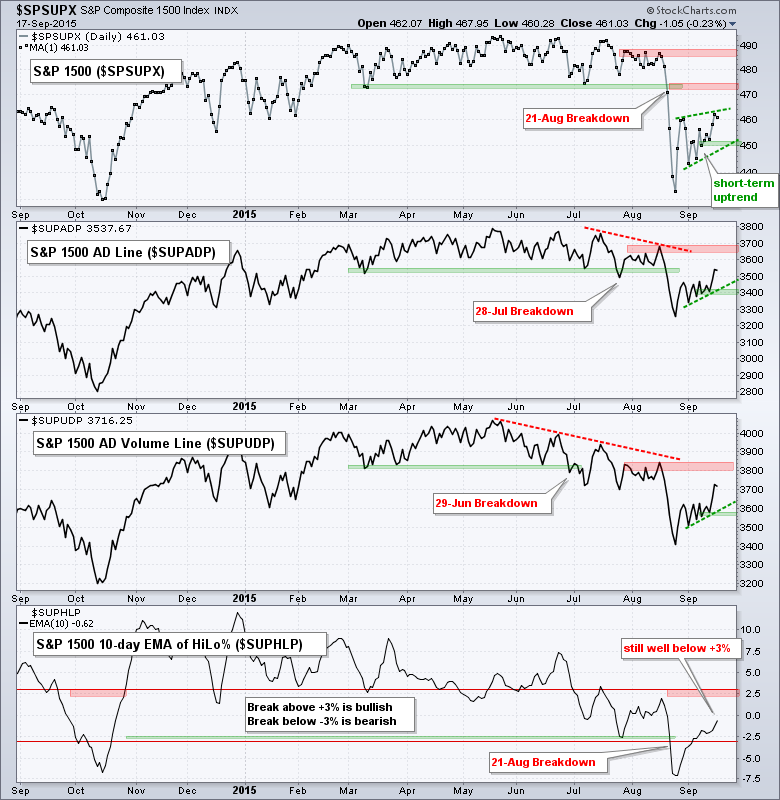
The S&P 1500 and the breadth indicators are in the midst of short-term uptrends with the green trend lines and green support zones defining these uptrends. Chartists should watch these levels for signs of a break down that would reverse these short-term uptrends. A reversal of the short-term uptrend would signal that the bigger downtrends were resuming.
Short-term Breadth Getting Overbought
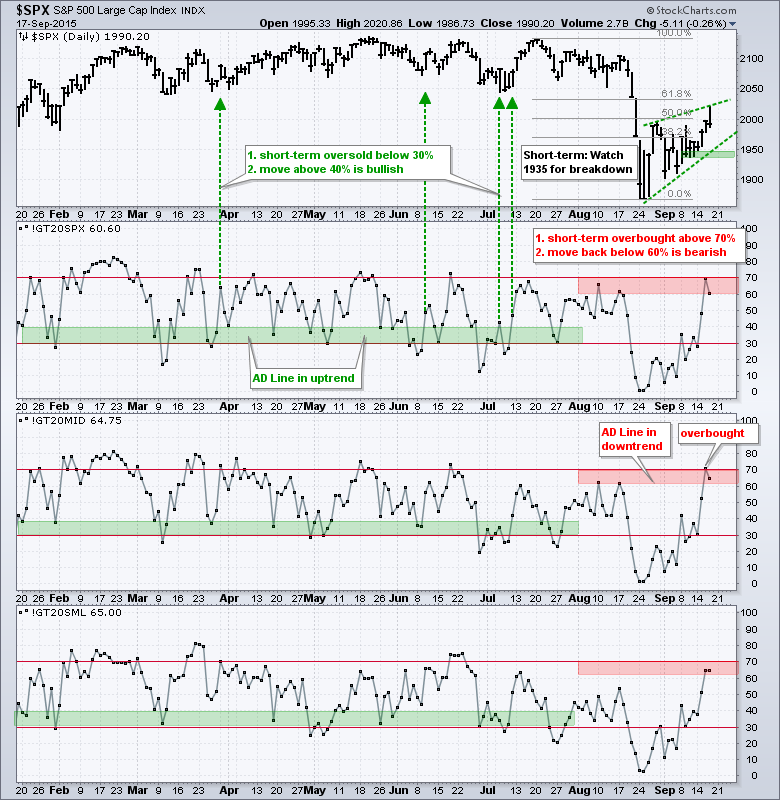
The next chart looks at the percentage of stocks above the 20-day EMA to identify short-term oversold and overbought conditions. The indicator is overbought when above 70% and oversold when below 30%. Note that I am interested in oversold conditions when the bigger trend is up and overbought conditions when the bigger trend is down. The bigger trend is currently down so I am only interested in short-term overbought conditions.
As the indicators currently stand, only the MidCap %Above 20-day EMA (!GT20MID) moved above 70% to become overbought. The S&P 500 %Above 20-day EMA (!GT20SPX) hit 69.8% on Wednesday and I think this is close enough to be considered short-term overbought. The Small-Cap %Above 20-day EMA (!GT20SML) fell short of the 70% level. Once the indicator becomes overbought, I look for a confirming signal to indicate that the indicator has turned back down. This requires a move below 60%. Thus, we would have short-term bearish signals should the indicators for the S&P 500 and S&P MidCap 400 move below 60%.
Triangle Evolves into Wedge
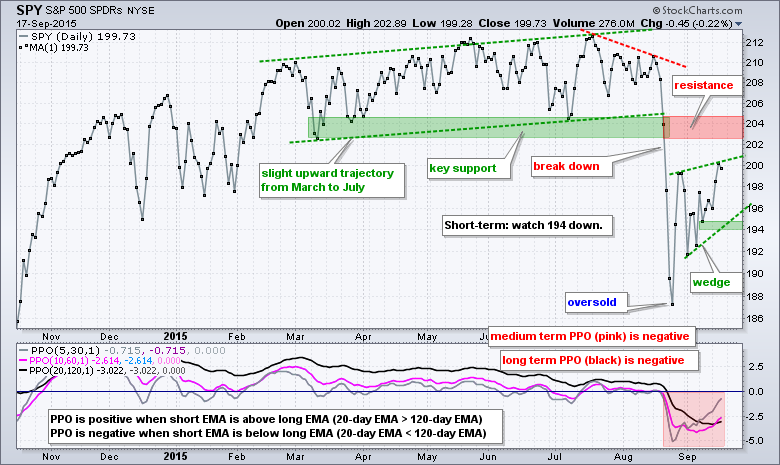
Last week (Friday) I showed triangle patterns taking shape in the S&P 500 and S&P MidCap 400. Both broke out with surges on Tuesday and these breakouts are short-term bullish. Keep in mind, however, that these breakouts are still not enough to affect the medium-term trends, which remain down. With the triangle breakouts and higher highs, we have new price information to incorporate into the chart and I am now drawing rising wedges to define the short-term uptrends. Short-term support for SPY is marked at 194.
QQQ and the PPO Trading Strategy
The charts with the three Percentage Price Oscillators (PPO) are designed for a trend-reversion trading strategy. As the name suggests, there are two parts to this strategy: trend-following and mean-reversion. Wait a minute? I thought trend-following and mean-reversion systems were diametrically opposed? Just like oil and vinegar, I have put these two concepts together to create a strategy that defines short-term pullbacks when the bigger trend is up and short-term bounces when the bigger trend is down. With the bigger trend down, I am now looking for short-term bounces that may create chances to partake on the downside.
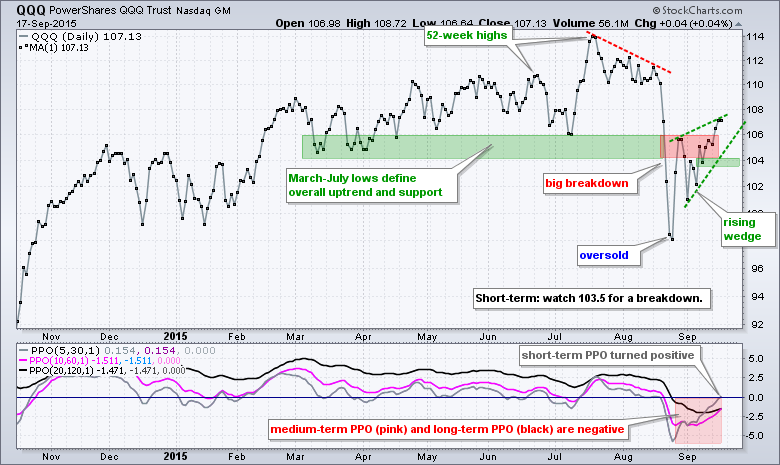
PPO (20,120,1) is a long-term trend indicator that is negative when the 20-day EMA is below the 120-day EMA. PPO (10,60,1) is a medium-term trend indicator that is negative when the 10-day EMA is below the 60-day EMA. As QQQ now stands, both PPOs are negative and this suggests that the bigger trend is down. With the bigger trend down, I am now looking for instances when PPO (5,30,1) turns positive because this occurs with a short-term bounce. At this point, we have a bearish setup in QQQ and are now awaiting the trigger (signal). PPO (5,30,1) would turn bearish with a move back into negative territory. Also notice that QQQ would reverse its rising wedge with a close below 103.5. I am seeing similar setups in IBB, IYT, RTH, XBI and XSD.
Uptrends are Few and Far Between
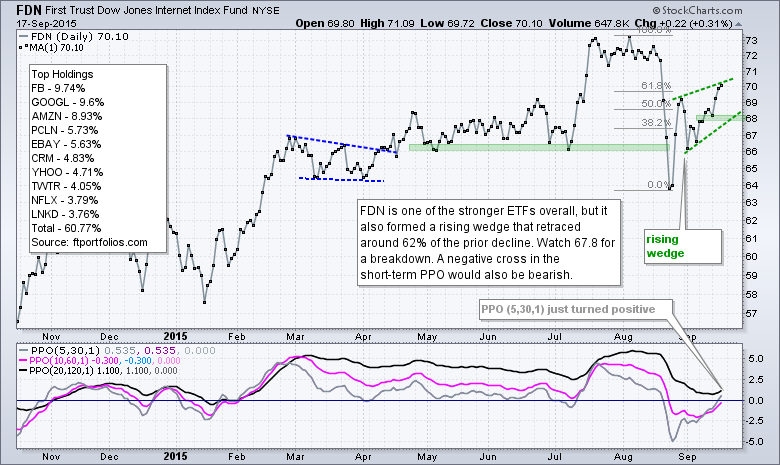
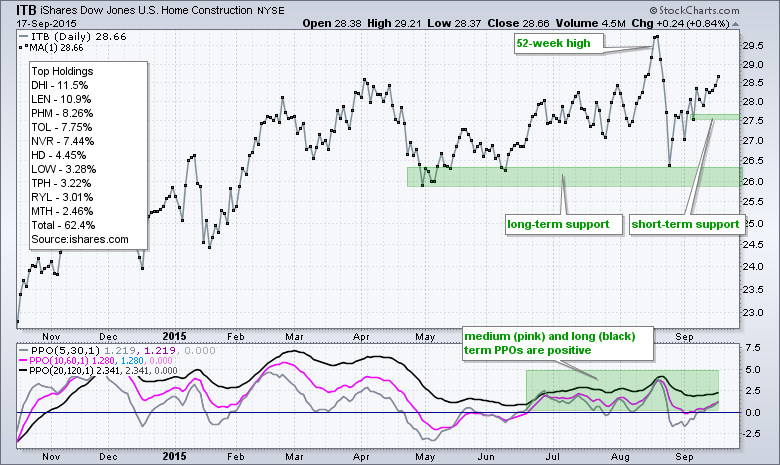
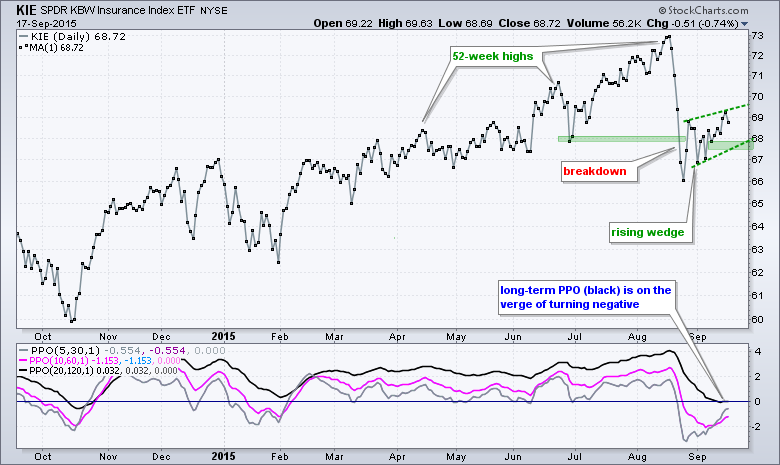
I keep ChartLists with 18 stock index ETFs, the 9 sector SPDRs, the 9 equal-weight sector ETFs and 57 industry group ETFs. Of these 93 stock-related ETFs, only four have positive long-term PPOs: the Home Construction iShares (ITB), the Internet ETF (FDN), the Insurance SPDR (KIE) and the Home Builders SPDR (XHB). The remaining 89 are in clear downtrends by this measure, which means the 20-day EMA is below the 120-day EMA. Note that I also think the Airline ETF (JETS) is in an uptrend, but it started trading in May and does not have a long enough history for the long-term PPO. In any case, there are not many uptrends at work and broad market weakness may just pull these four down.
7-10 YR T-Bond ETF Breaks Wedge Resistance
The falling wedge is the counter-part to the rising wedge and we are seeing these patterns in the bond market. The falling wedge is typical for a correction after an advance as it retraces a portion of this advance. The short-term trend is down as long as the wedge falls. A break of wedge resistance reverses this short-term downtrend and signals a continuation of the prior advance.
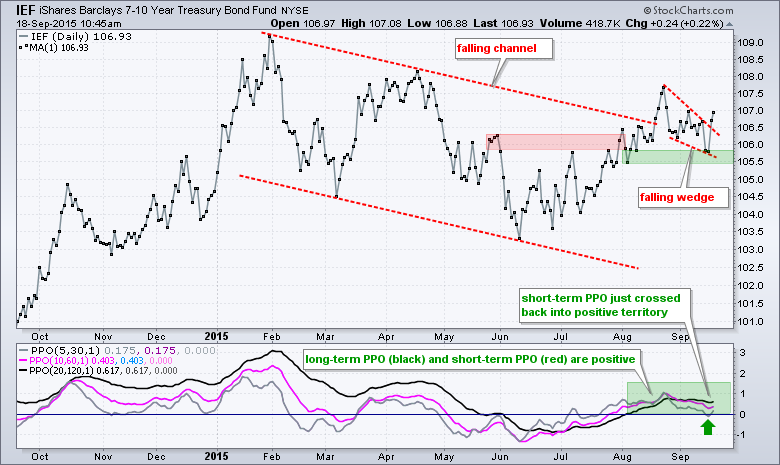
The 7-10 YR T-Bond ETF (IEF) advanced from June to late August and then formed a small falling wedge. Notice that the long-term and medium-term PPOs turned positive during this advance. Also notice that the short-term PPO turned negative during the pullback. It looks like the wedge is reversing as IEF broke the upper trend line and exceeded Monday's high. Also notice that the PPO (5,30,1) turned up and broke back into positive territory.
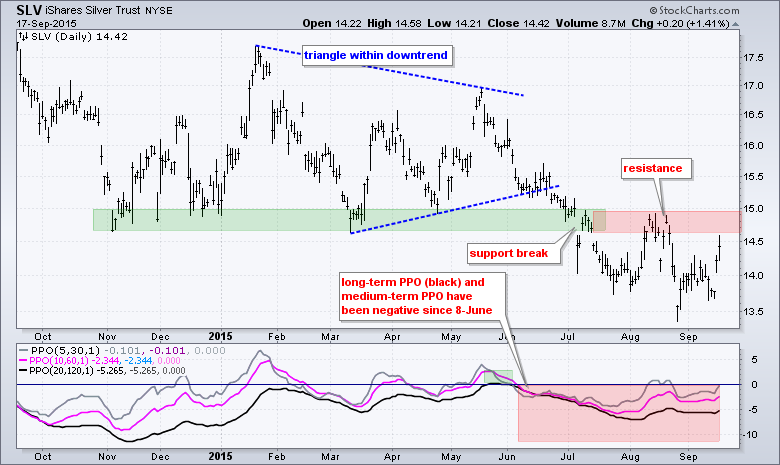
Gold and Silver Challenge Resistance
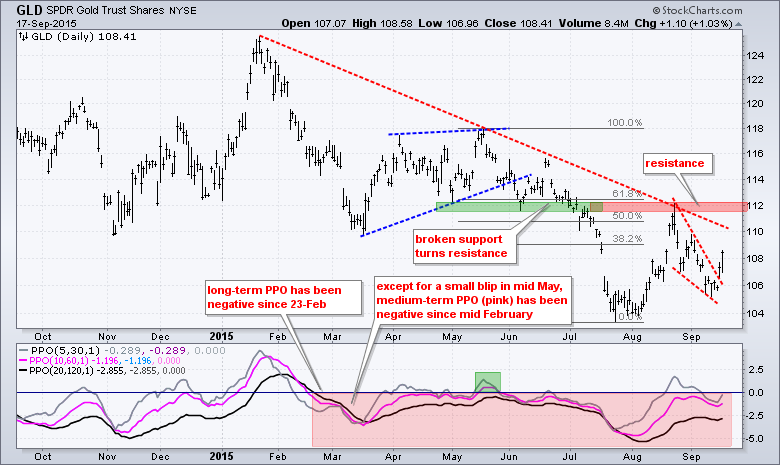
The Gold SPDR (GLD) remains in a downtrend overall, but got a short-term wedge breakout over the last few days and looks poised to challenge resistance. Notice that GLD formed a higher low from early August to mid September and a break above the August high would reverse the downtrend on the daily chart. Silver is also making a run at resistance as the Silver ETF (SLV) challenges its August highs.
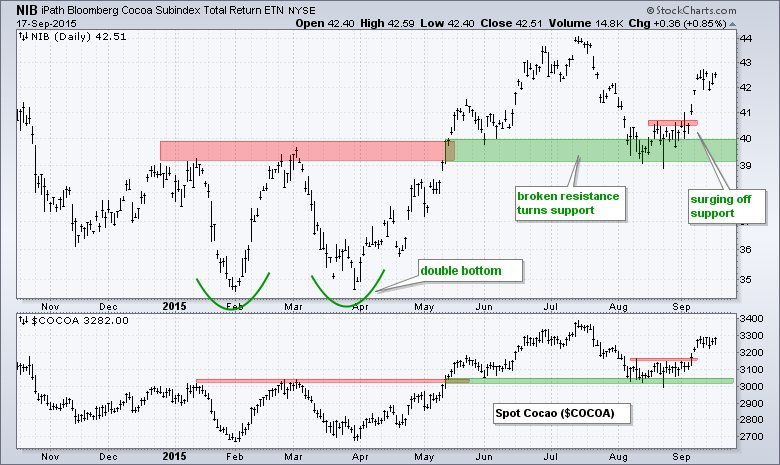
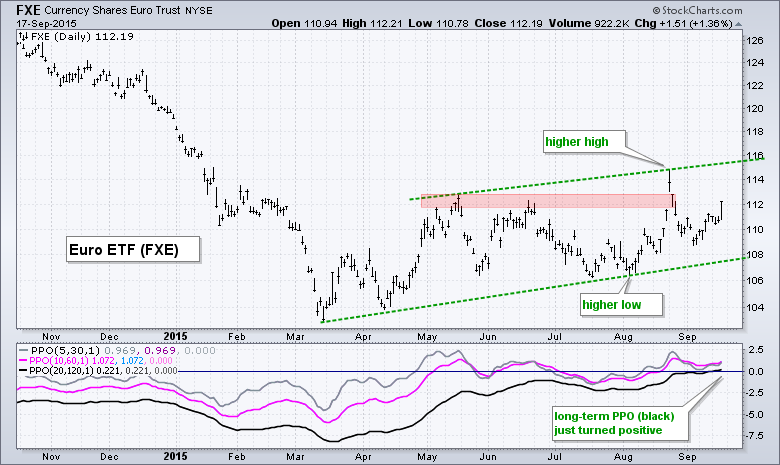
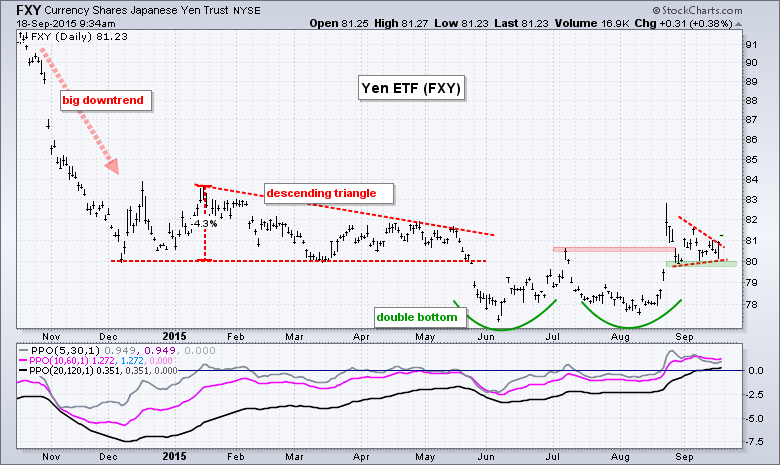
Cocoa, Euro and Yen Extend Uptrends
And finally, I leave you with three uptrends outside of the stock-bond universe. The Cocoa ETN (NIB) broke double bottom resistance in May, successfully tested this breakout in August and surged off support in September. The Euro ETF (FXE) is in a rising channel and the PPO (20,120,1) just turned positive. The Yen ETF (FXY) broke double bottom resistance, consolidated and surged on Thursday. The PPO (20,120,1) also just turned positive. Strength in the Yen is negative for the Nikkei. Strength in the Euro and Yen is negative the US Dollar ETF (UUP), and possibly bullish for bullion.
******************************************
Thanks for tuning in and have a great weekend!
--Arthur Hill CMT
Plan your Trade and Trade your Plan
******************************************


