Embracing Relative Performance
There is really only one thing to do with relative performance metrics: embrace them. If large-caps are outperforming small-caps, then favor large-caps over small-caps. If the consumer staples sector is outperforming the consumer discretionary sector, then favor consumer staple stocks over consumer discretionary stocks. Following relative strength and shunning relative weakness is the best chance at outperforming the broader market.
The chart below shows the performance for eight major stock indices since the late September low. The Russell 2000 and the S&P MidCap 400 are up 7% and 6.4%, respectively. These are big numbers for just four weeks, but these gains are not as big as the gains seen in the S&P 500 (+10.04%) and the Nasdaq 100 (+13.45%).
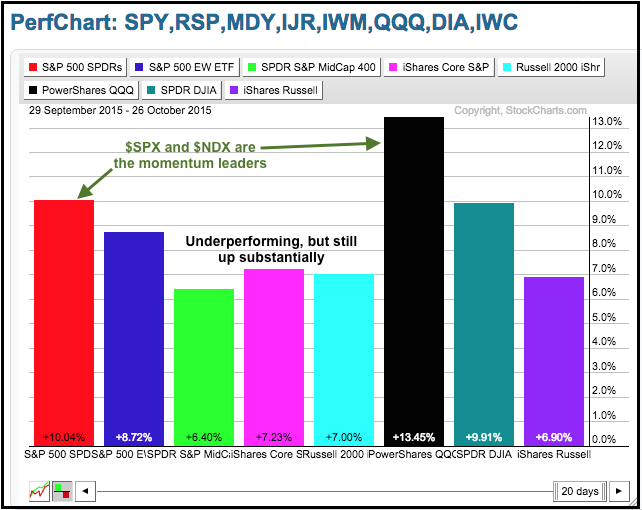
What exactly does this performance chart tell us and how can be use this information? First, we know that large-caps and large-techs are outperforming, while small-caps and mid-caps are underperforming. Small-caps and mid-caps are, however, by no means weak because their respective indices are up. This information tells us to look for bullish setups in large-caps and large-techs because this is where the price momentum is right now. This relative performance picture could change in the coming weeks, but that's the way is it is right now.
Two Sectors Stand Out from the Rest
We can break down the stock market further by looking at the sector SPDRs and the equal-weight sector ETFs. The table below shows the 9 sector SPDRs and the 9 equal-weight sector ETFs ranked by the StockCharts Technical Rank (SCTR). As a whole, the technology and consumer staples sectors are by far the strongest. Notice that both the SPDRs and equal-weight sector ETFs have SCTRs above 90. The Consumer Discretionary SPDR (XLY) is also strong with a SCTR above 90, but the EW Consumer Discretionary ETF (RCD) is not as strong because its SCTR is below 80.
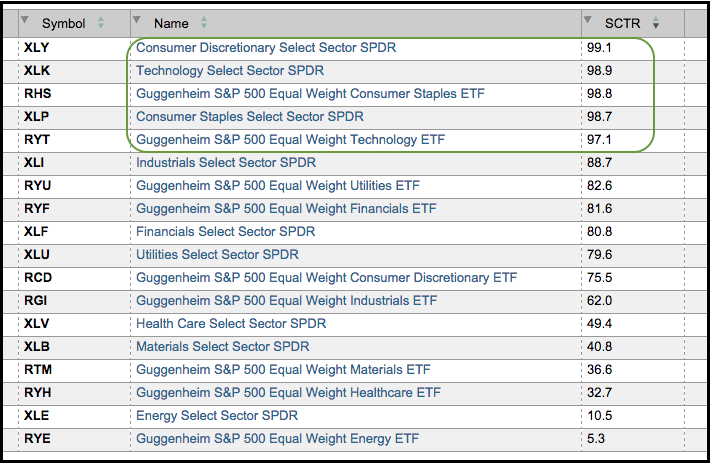
This table tells chartists to focus on stocks in the technology and consumer staples sectors for bullish setups. I would also note that the Finance SPDR (XLF) and the EW Finance ETF (RYF) have SCTRs above 80 and are showing some relative strength overall. On the downside, energy, materials and healthcare are still to be avoided because both the SPDRs and the equal-weight sector ETFs have SCTRs below 50. In fact, the SCTR for the EW Energy ETF (RYE) is below 10. Oh, and note that XLY, XLK, XLP and RHS hit new 52-week highs over the past week.
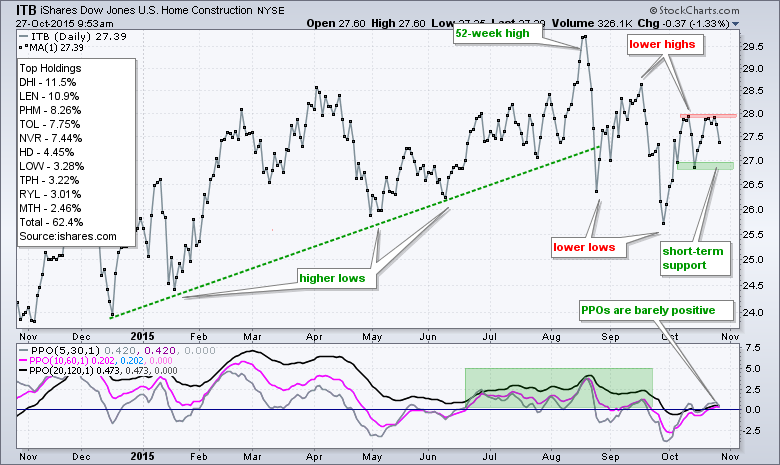
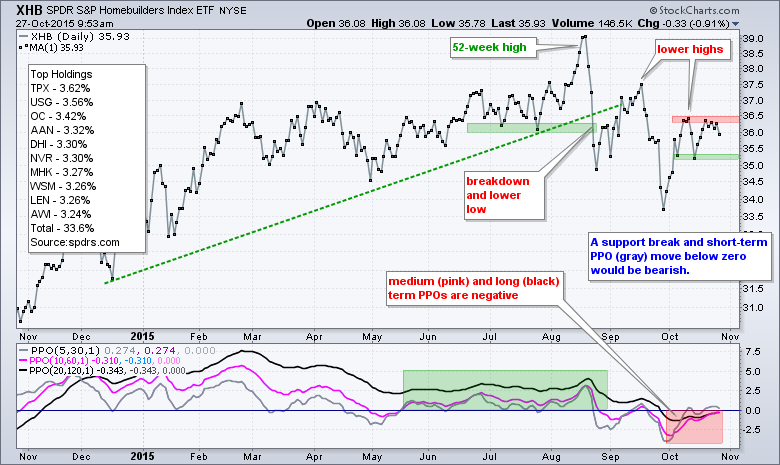
Housing ETFs Fall Short
Retail and homebuilding are holding the consumer discretionary sector back. We can see here that the broader stock market is not hitting on all cylinders, but this weakness tells us to avoid housing and retail right now. The Home Construction iShares (ITB) broke down in August and has since formed a series of lower highs and lower lows. The early October surge fell short of the mid September high and the ETF failed to close above 28 last week and break resistance. A close above this level is needed to reverse the downtrend since late August. Barring an upside breakout, a move below short-term support and a PPO (5,30,1) cross into negative territory would signal a continuation lower.
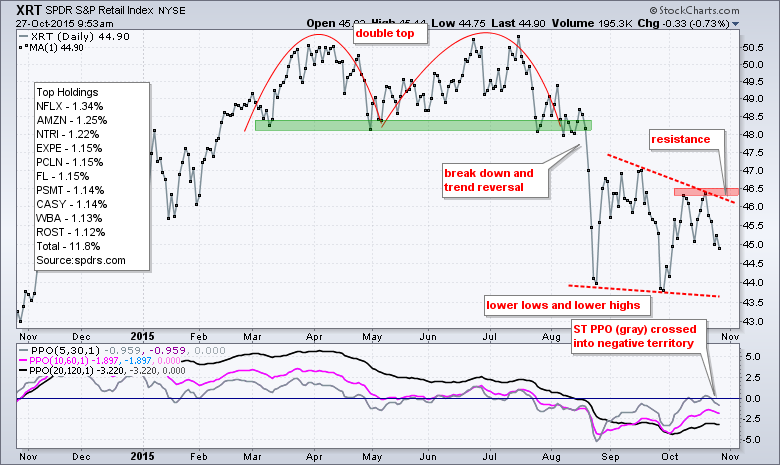
Retail ETF Turns Back Down
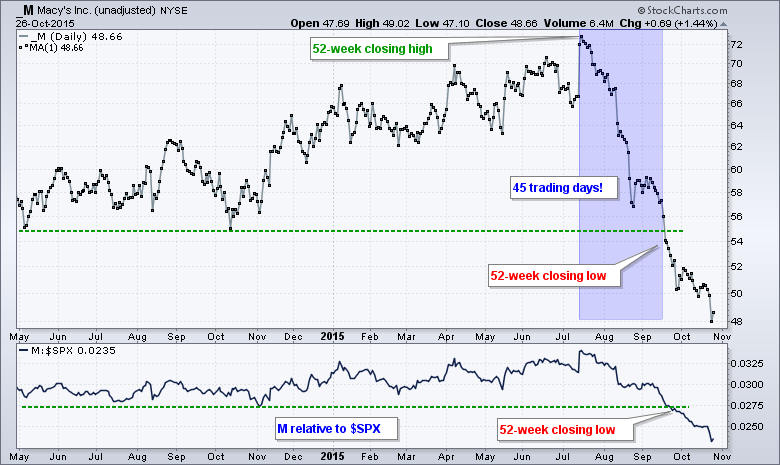
The persistent downtrend in the Retail SPDR (XRT) is also a concern for the consumer discretionary sector. Since the double top break down in August, the ETF formed a lower low in late September and a lower high in mid October. Thus, the downtrend continues. The medium-term and long-term PPOs are negative and the short-term PPO moved below zero for a bearish signal last week. XRT is bearish on most timeframes and a close above 46.5 is needed to reverse the downtrend. In a separate, but related note, notice how Macy's moved from a 52-week high in mid July to a 52-week low in mid September - in just 45 trading days. I get that 80% of the stocks in XRT are competing with Amazon.
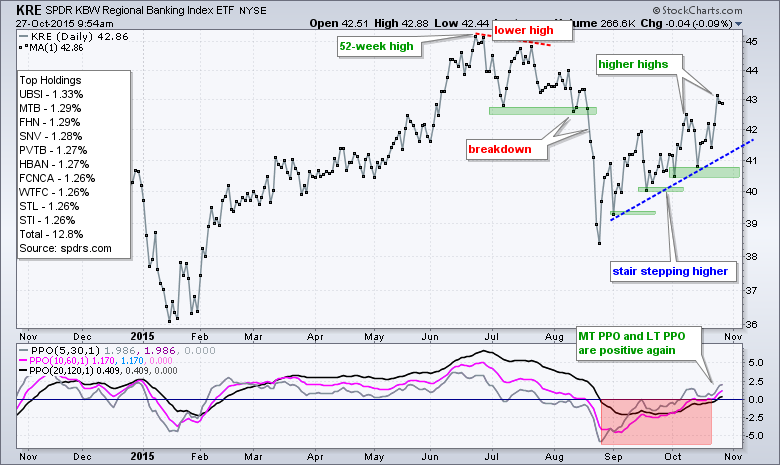
KRE Extends Higher as Insurance Leads
The finance sector is one of the stronger sectors right now. The SCTR for the EW Finance ETF (RYF) is near 80 and the ETF is within 4% of a 52-week closing high. The Regional Bank SPDR (KRE) continues to stair-step higher with a series of higher highs and higher lows since late August. I see relative strength since August because the ETF did not test its August low in September and scored two higher highs in October. Also notice that the long-term and medium-term PPOs turned positive again. The cup is half full for KRE as long as it holds the October lows.
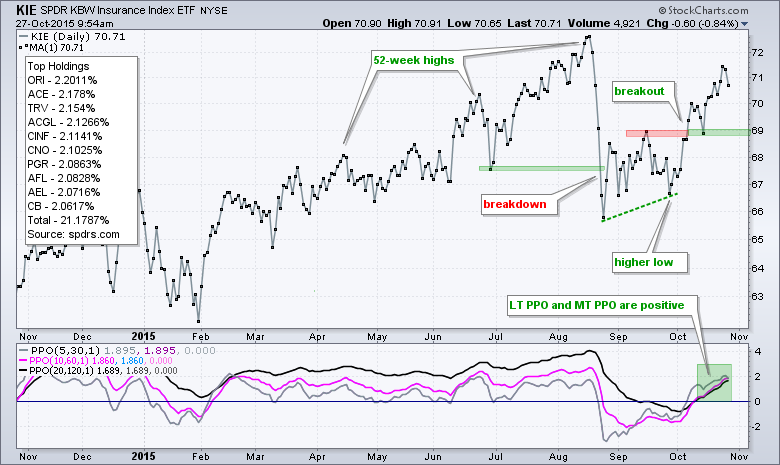
The Insurance SPDR (KIE) represents the strongest part of the finance sector. Even if you do not trade ETFs, strength in KIE tells us to be looking at insurance stocks as momentum leaders in the market right now. On the chart, KIE formed a higher low in late September and broke out with a surge in October. Notice that the PPO (10,60,1) and PPO (20,120,1) turned positive the second week of October. Also note that KIE was one of the first ETFs to have both PPOs turn positive again.
Energy ETFs Turn Down from Resistance
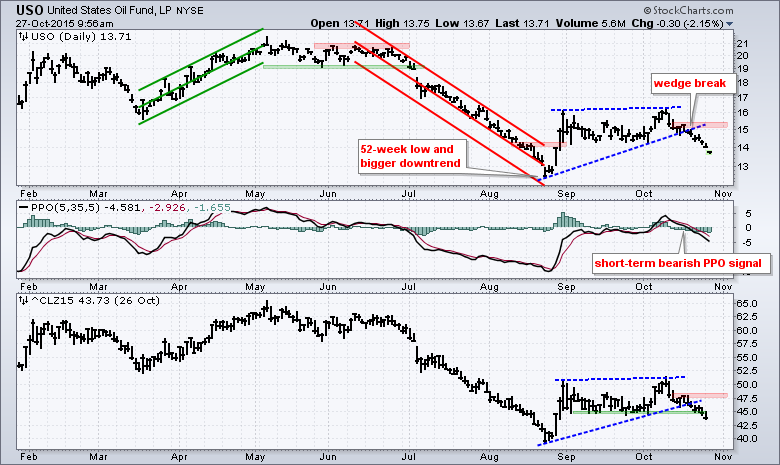
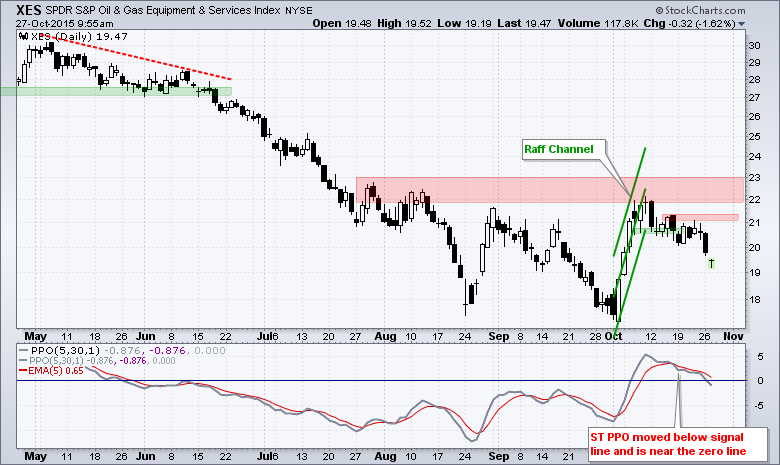
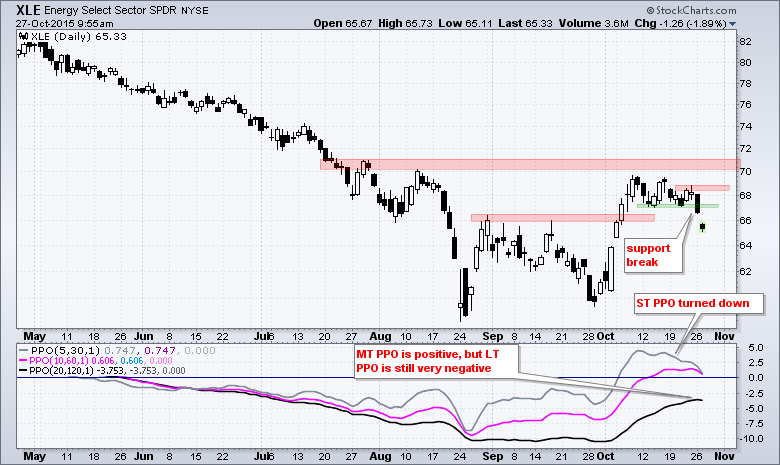
As noted in the webinar last Tuesday, the USO Oil Fund (USO) is in a long-term downtrend and the PPO (5,30,5) triggered a short-term bearish signal. This signal was followed by bearish PPO signals in the Energy SPDR (XLE) and Oil & Gas Equip & Services SPDR (XES). Also of note, NatGas hit a multi-year low and the US Gasoline ETF ($UGA) broke triangle support recently. On the charts below, XES failed at resistance and the PPO (5,30,5) turned down in mid October. XLE held out a bit longer, but the PPO (5,30,1) turned down last week and the ETF broke short-term support on Monday. Energy is not the place for longs right now.
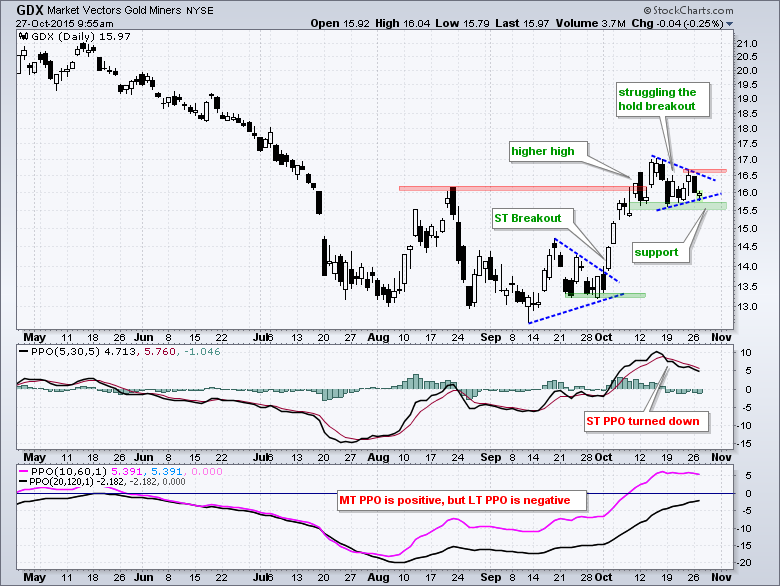
GDX Battling Breakout
Before getting into the Gold Miners ETF (GDX), note that most commodity-related ETFs are in long-term downtrends, as are most commodities. The ETFs include: SLX, XME, COPX, KOL, FCG, XES and AMLP. Most commodities are also in long-term downtrends. Note that the Aluminum ETN (JJU) hit a new low this week and the Copper ETN (JJC) is around 5% from its low. Even though gold is its own beast, the downtrend in commodities and related industry groups does not bode well for the Gold Miners ETF.
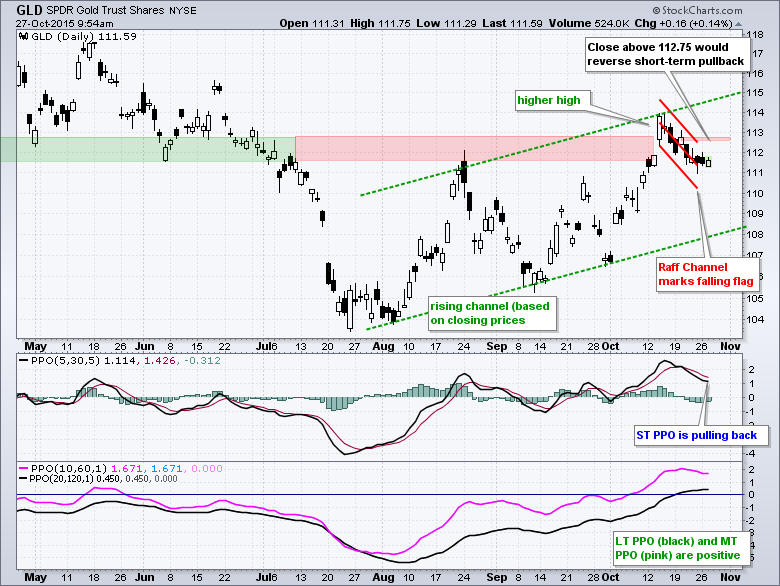
On the price chart, GDX formed a double bottom in August-September and broke out in October. The ETF is stalling near the breakout zone as a triangle takes shape. A move above 16.7 would break triangle resistance and be bullish. There is also a chance that the breakout fails. Notice that the medium-term PPO (10,60,1) is positive, but the long-term PPO (20,120,1) is negative. The long-term PPO carries more weight and the short-term PPO (5,30,5) just turned down last week. I would give the bulls the benefit of the doubt as long as 15.5 holds for GDX. A break below 15.5 would negate the double bottom breakout and be bearish. Note that GDX is not going anywhere unless the Gold SPDR (GLD) breaks out.
****************************************
Thanks for tuning in and have a good day!
--Arthur Hill CMT
Plan your Trade and Trade your Plan
*****************************************


