Small-caps Gear Up for Big Test // Using %B to Identify Oversold Conditions // Indicators Overshoot for QQQ // IWM Remains with a Bullish Setup // Intraday or End-of-day Signals? // Treasuries Signal Risk On // XLF Surges as KRE and IAI Break Out //// ...........
Small-caps Gear Up for Big Test
Today I will show QQQ, SPY and IWM with three momentum oscillators. Two are designed to identify overbought/oversold conditions. The third is designed to identify a momentum pop (up or down) in RSI. First and foremost, note that my longer term indicators are bullish and I think the bigger trends are up for SPY, QQQ and IWM. This means I am not interested in short-term bearish setups or patterns. I am interested in pullbacks within the bigger uptrend because I view pullbacks as opportunities. One of these pullbacks will eventually result in a bearish reversal of the bigger uptrend, but that has yet to happen so I will stick with my current assumption (until proven otherwise). See the Friday reports to long-term analysis.
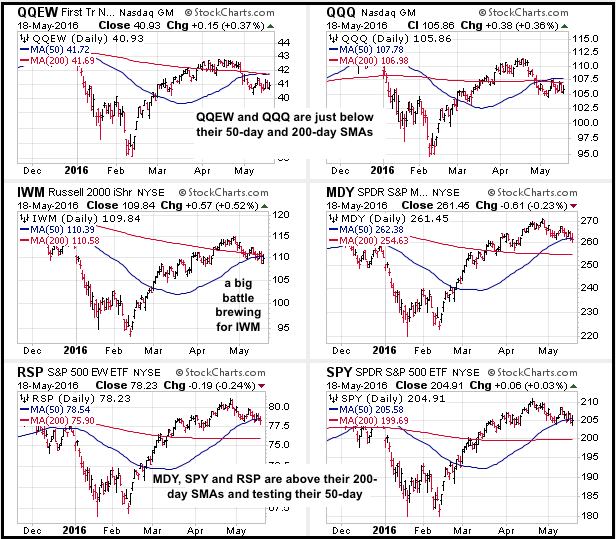
The chart above shows six major index ETFs with the 50-day SMA in blue and the 200-day SMA in red. QQQ and QQEW are the weakest of the six because they are below their 200-day SMAs. IWM is trading right at both moving averages and this means small-caps are gearing up for a big test. A surge off these moving average would be quite bullish for IWM. MDY, SPY and RSP are above their 200-day SMAs and still in long-term uptrends. These three are clearly holding up the best.
Using %B to Identify Oversold Conditions
The first chart shows SPY firming with a spinning top candlestick near first support in the 204 area. The short-term trend is down right now with a Raff Regression Channel defining this downtrend. While a break below 204 would be "negative", it would just be a continuation of the short-term downtrend. I view the 200-204 area as a support zone and would be on guard for a reversal in this zone.
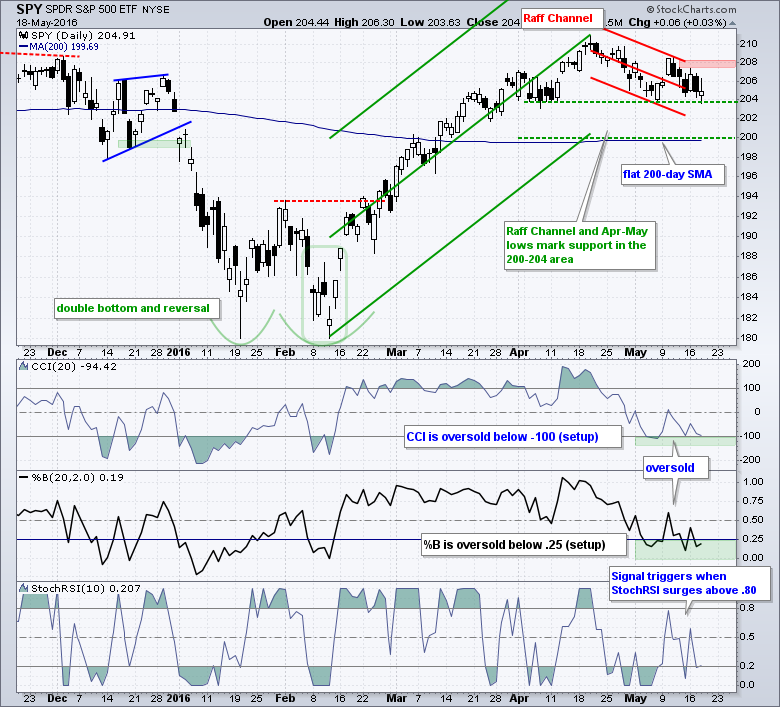
The indicator windows show the Commodity Channel Index (CCI), %B and StochRSI. %B measures the level of the close relative to the upper and lower Bollinger Bands. %B equals 1 when price is at the upper band and is greater than 1 when above the upper band. Conversely, %B is 0 when price is at the lower band and below 0 when price is below the lower band. %B is considered oversold when below .25 and CCI is considered oversold when below -100. Once these become oversold, I then turn to StochRSI to look for a momentum pop, which is the first clue that the short-term trend may be reversing. Thus far, CCI and %B have become oversold in May, but StochRSI has yet to pop above .80 to show an upthrust in momentum. Stay tuned....
Indicators Overshoot for QQQ
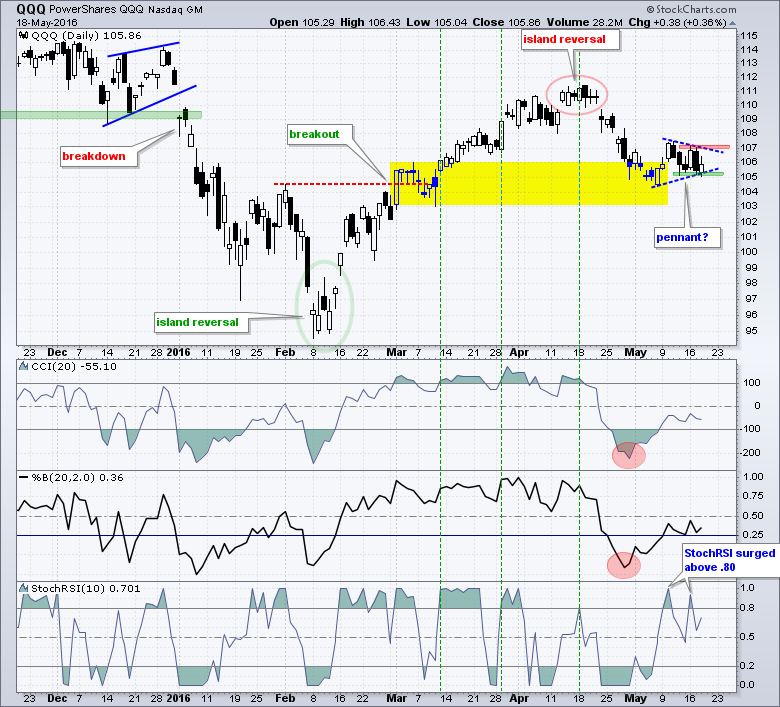
The chart for QQQ is a little different because the ETF peaked before SPY and fell sharply from mid April to early May. This decline pushed CCI below -200 and %B below zero, which is deemed a bit excessive for a mere pullback. Severe oversold readings are more consistent with a downtrend than an uptrend. On the price chart, QQQ formed a pennant over the last two weeks and this could be a bearish continuation pattern. A break below 105 would signal a continuation lower. Chartists can watch for a close above 107.3 to trigger a short-term bullish breakout.
IWM Remains with a Bullish Setup
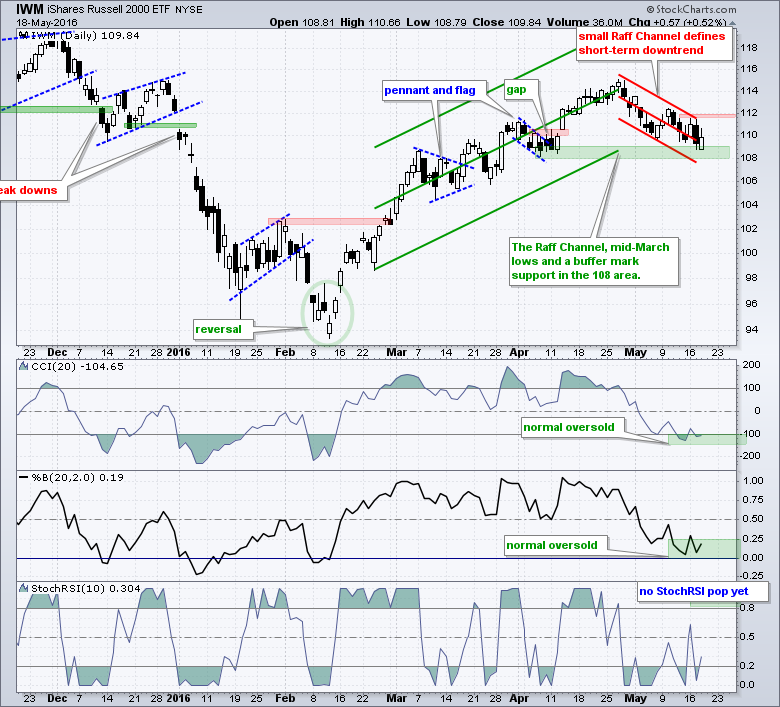
IWM remains in a short-term downtrend defined by the Raff Regression Channel and resistance at 112. A close above this level would reverse the four week slide. CCI and %B became oversold with moves below -100 and .25, respectively. They have not become excessively oversold (> -200 and >0). I am now just waiting for StochRSI to pop above .80 or IWM to break out on the price chart.
Intraday or End-of-day Signals?
I showed the EW S&P 500 ETF (RSP) on Tuesday with the short-term PPO (5,30,1) and CCI(20). The PPO triggered bullish when it moved back above the zero line last week, but the oscillator fell back below zero this week. RSP closed above support at 78, but remains in a downtrend since late April. The decline below zero puts the PPO back in setup mode and I am looking for a cross above the zero line for another bullish signal. Alternatively, chartists can look for StochRSI to pop above .80 for a bullish momentum signal.
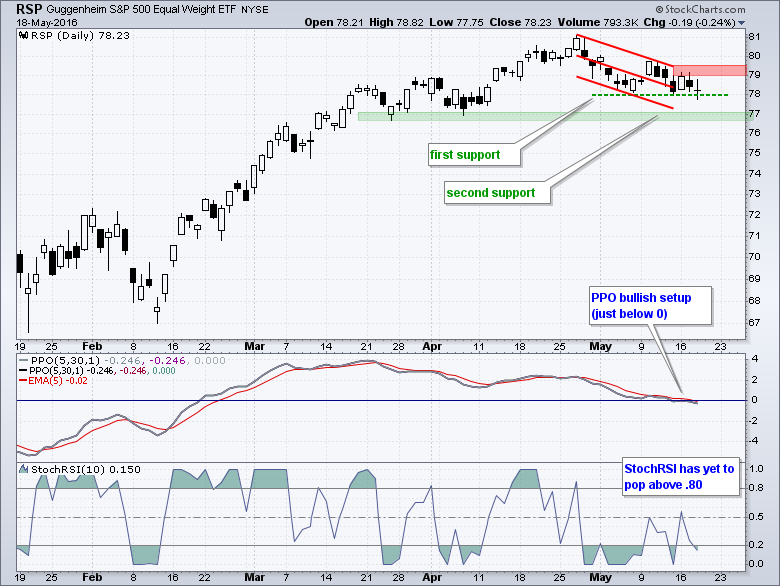
I am often asked if signals should be based on intraday or closing prices. Sorry for this answer, but.... it depends. Are you an active trader who follows the market during the day? Do you use intraday chart? Are you semi-active and only look at daily charts? The daily PPO is based on closing prices so intraday signals are subject to change until the actual close. Signals based on closing prices are not subject to change because the close is set. It is your choice and this choice should be made before taking a trade, not in the heat of the moment. The same goes for setting stop-losses. The choice of intraday or close is up to you. Personally, I favor daily charts and closing prices.
Treasuries Signal Risk On
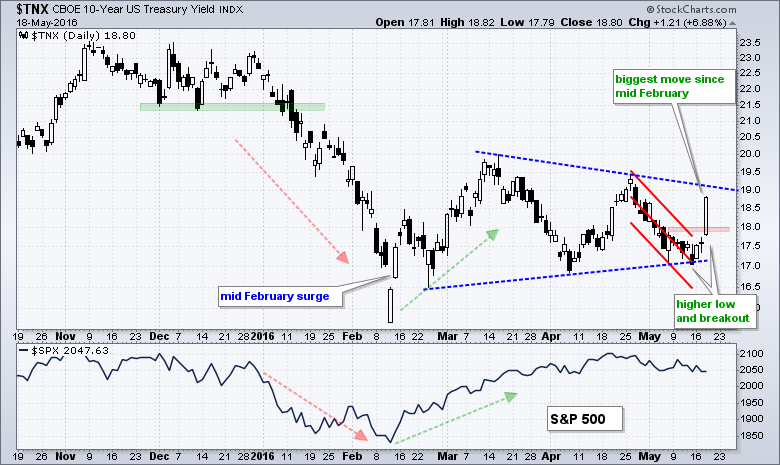
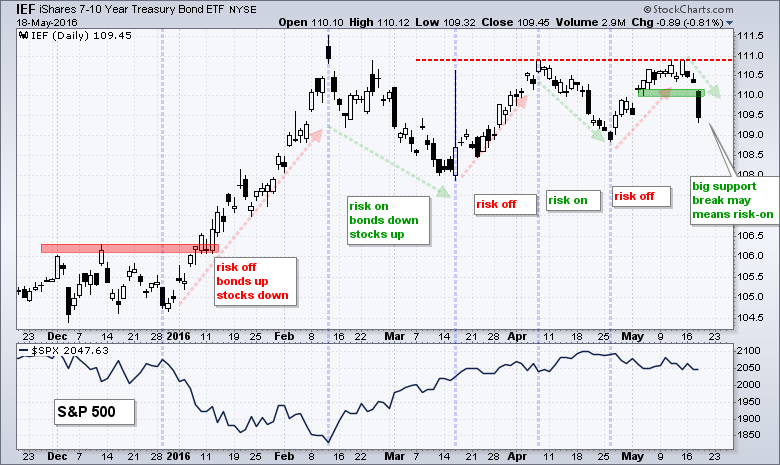
I featured charts of the 10-YR Treasury Yield ($TNX), Finance SPDR, Regional Bank SPDR and Broker-Dealer iShares on Tuesday. These were shown together because I thought the 10-yr yield was at its moment-of-truth. Well, $TNX made a big statement yesterday with its biggest move since mid February. This also happens to be when the S&P 500 bottomed and began a strong run. The short-term breakout in the 10-yr yield is positive for stocks because stocks are positively correlated to the 10-yr yield (and negatively correlated to the 7-10 YR T-Bond ETF). It also means that money is moving out of safe-haven bonds and this money may find its way into riskier assets, such as stocks. Note that utilities, consumer staples and REITs often underperform when the 10-yr yield rises.
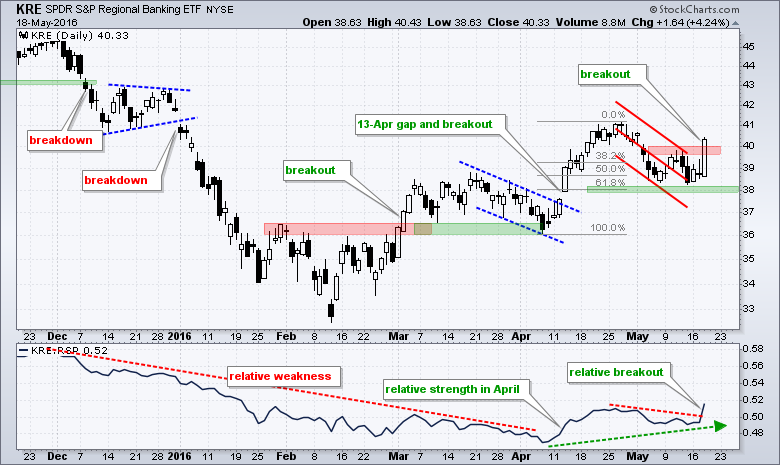
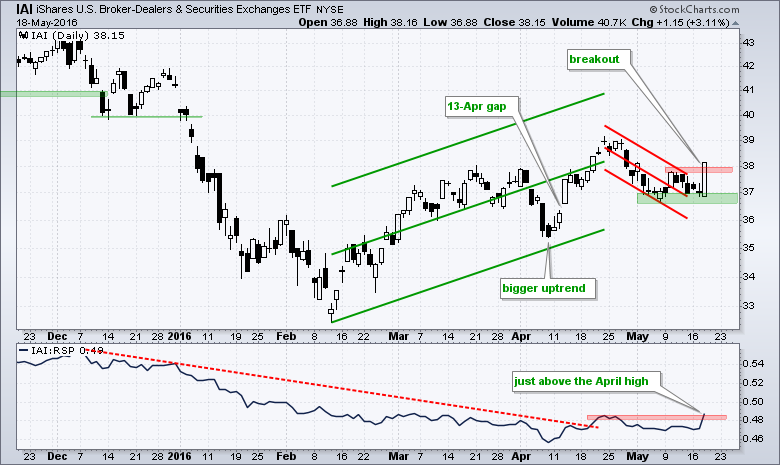
XLF Surges as KRE and IAI Break Out
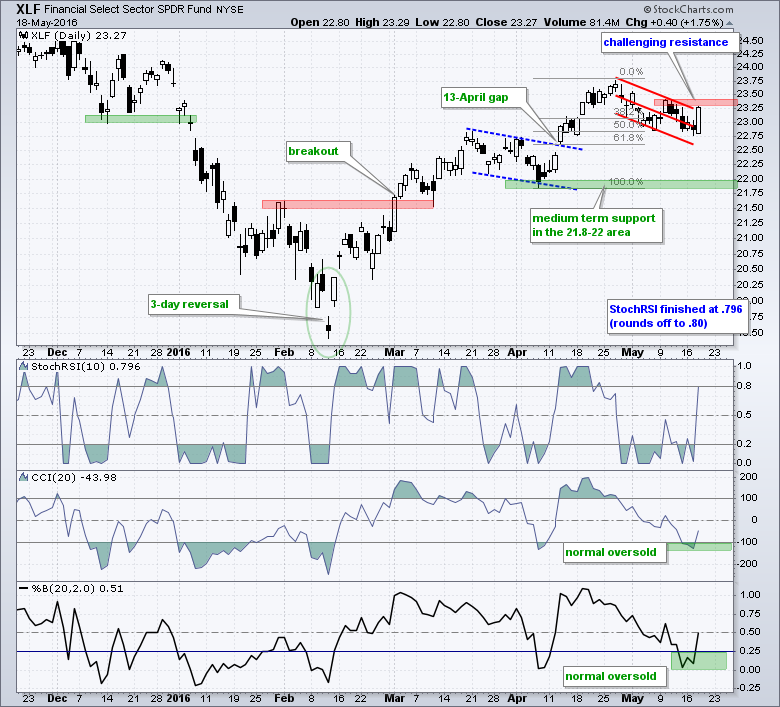
The next three charts show XLF challenging resistance, KRE getting a big breakout and IAI joining with a big move. These breakouts are bullish until proven otherwise and I am raising key support to the May lows. Note that the finance sector accounts for around 26% of the Russell 2000 and 16% of the S&P 500. Strength in this sector is key to small-cap performance and should support the broader market.
******************************************************
Measuring Risk On-Risk Off - Using charts to quantify stock, economic and credit risk.
PPO Trading Strategy - How to use 3 PPOs to develop a trend-reversion trading strategy.
Long-term Trend Indicators - Using the PPO, EMA Slope and CCI to determine the trend.
ETF Master ChartPack - 300+ ETFs organized in a Master ChartList and in individual groups.
Follow me on Twitter @arthurhill - Keep up with my 140 character commentaries.
****************************************
Thanks for tuning in and have a good day!
--Arthur Hill CMT
Plan your Trade and Trade your Plan
*****************************************


