SPY and MDY are Barely Positive this Month // RSI(5) and the Dreaded Double Dip // The Noose Continues to Tighten for Treasuries // How Yields Effect Gold, Utilities and Finance // US 10-yr Yields Sticks Out // XLF and KRE Maintain Breakouts // XLU and IYR Forge Bullish Setups // Gold Breaks, but Becomes Oversold //// .....
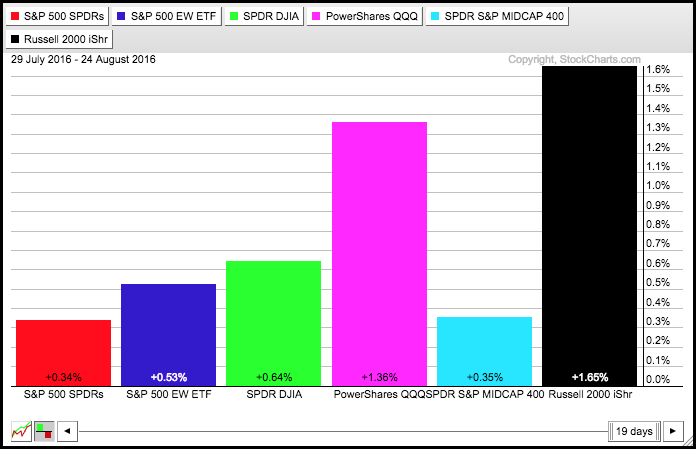
The major index ETFs fell modestly on Wednesday, but remain positive for the month of August (18 trading days). They are not up by much this month so it would not take much to push them in the red month-to-date. IWM and QQQ are leading this month with 1+ percent gains. SPY and MDY are lagging with gains less than .5%.
RSI(5) and the Dreaded Double Dip
There are three stages to a trade: the setup, the entry and the exit. I am working under the assumption that we are in a bull market for stocks and this means I am only interested in long positions. I am not looking to trade against the bigger trend so I am ignoring short-term bearish signals. Instead, I am entering longs, setting stops and looking for bullish setups. With the major index ETFs in short-term uptrends, the only thing to do now is consider stops on short-term trades. The chart below shows IWM with the Chandelier Exit (22,2) at 121.77 and this level could be used for a trailing stop.
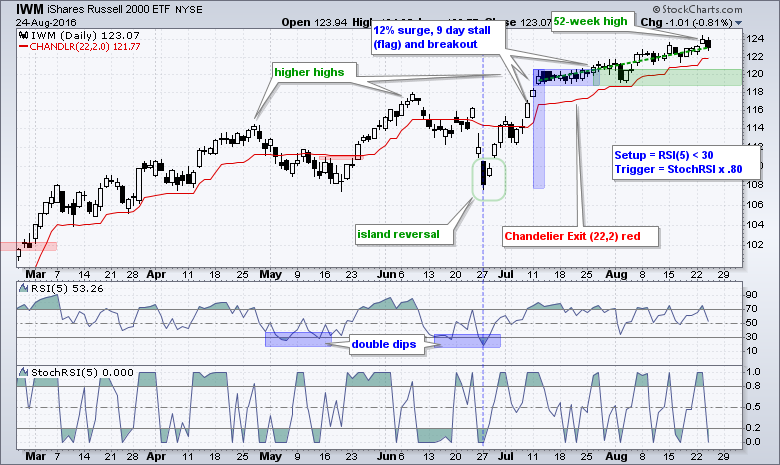
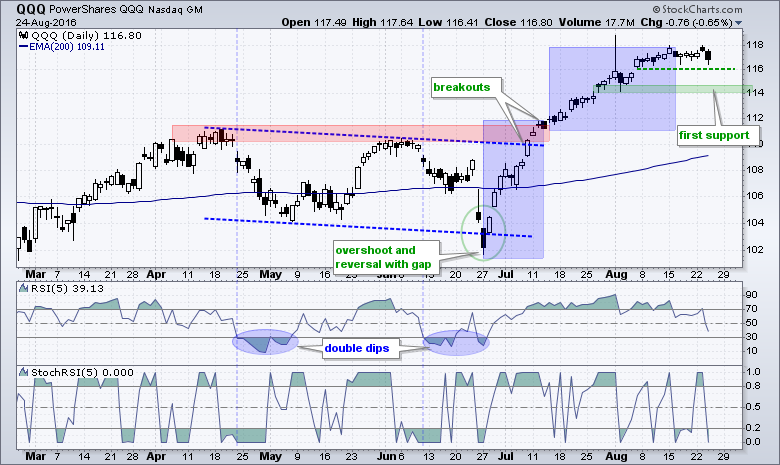
As far as another setup, I will wait for a short-term oversold condition and/or a move into the support zone in the 119-120 area. IWM would become short-term oversold should RSI(5) move below 30. The next chart shows QQQ with first support marked around 114 and RSI(5) near 39. A move below 30 would suggest a short-term oversold condition, but I would be careful for the extended dip or the dreaded double dip. Notice how RSI(5) was oversold for almost two weeks in late April and did a double dip in June (blue ovals). These means the first signal did not work, which sometimes makes it harder to take the second signal, which did work. I do not want to predict another double dip, but it is certainly possible in the coming weeks as volume picks up and September-October hit.
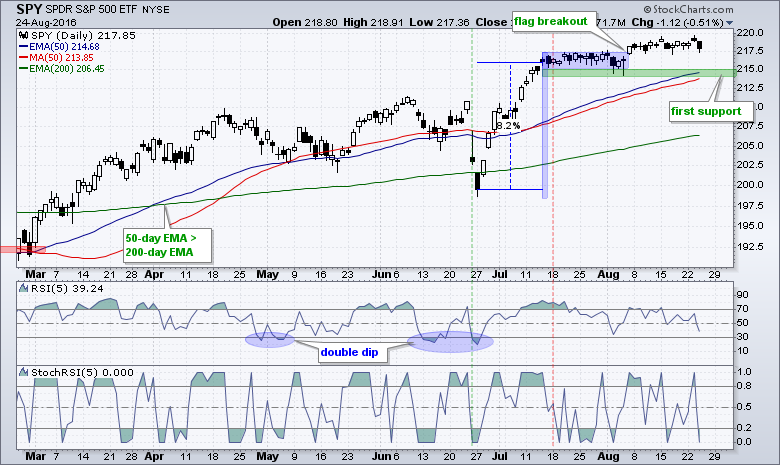
SPY has first support in the 214-215 area from the flag lows and rising 50-day EMA (blue). I don't use moving averages to mark support normally, but the S&P 500 is a different beast because so many people follow it and its 50-day moving average. Note the 50-day SMA is in red. RSI(5) is also near 39 and the prior double dips are shown in blue.
The Noose Continues to Tighten for Treasuries
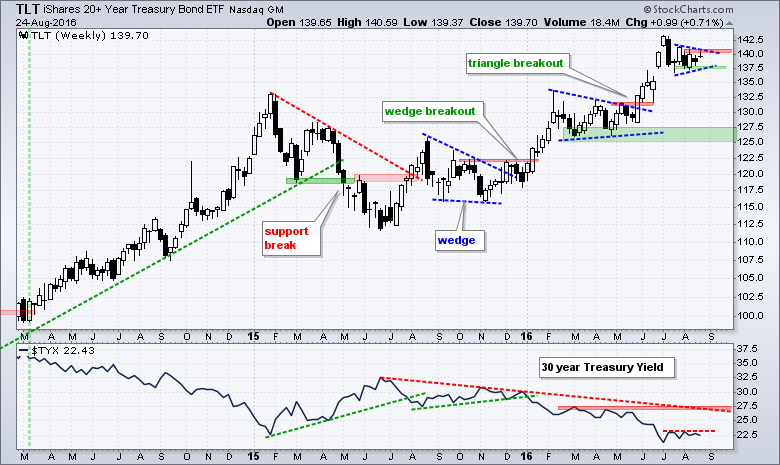
Treasury bonds are obviously in the spot light because Fed chair Janet Yellen is scheduled to speak on Friday from Jackson Hole. While it is clear that speeches and sentences can move markets, such as Clinton and Biotechs, I have no special insight on Yellen's speech or the next Fed move. On the price charts, the 20+ YR T-Bond ETF (TLT) and 10-YR Treasury Yield ($TNX) continue to gear up for a move as consolidations extend. The long-term trend for TLT is clearly up, but the ETF was hit with a sharp decline in early June (long black candlestick). A small triangle formed the last six weeks and I am watching this range for the next directional clue. An upside breakout at 141 signals a continuation of the bigger uptrend. A downside break at 137.5 would argue for a decline to the 132-132.5 area. The indicator window shows the 30-YR Treasury Yield ($TYX) with first and second resistance.
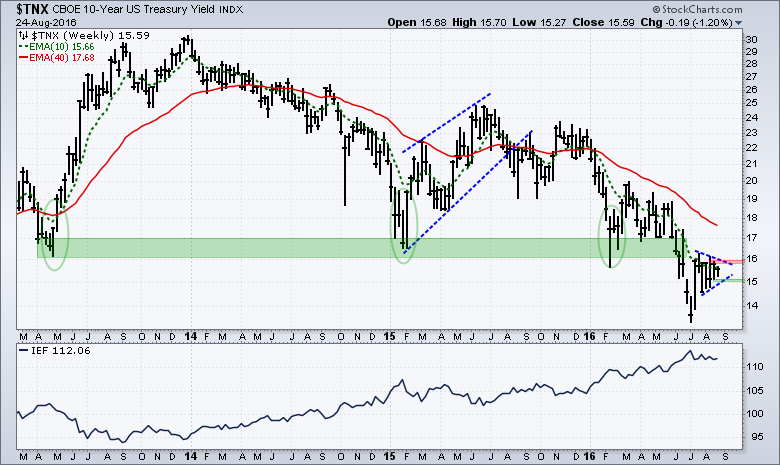
The 10-YR Treasury Yield is in a long-term downtrend because the 10-week EMA has been below the 40-week EMA since January. $TNX recently broke to new lows, but immediately bounced and firmed with a triangle the last few weeks. Watch 16 up and 15 down (1.6% and 1.5%, respectively.
How Yields Effect Gold, Utilities and Finance
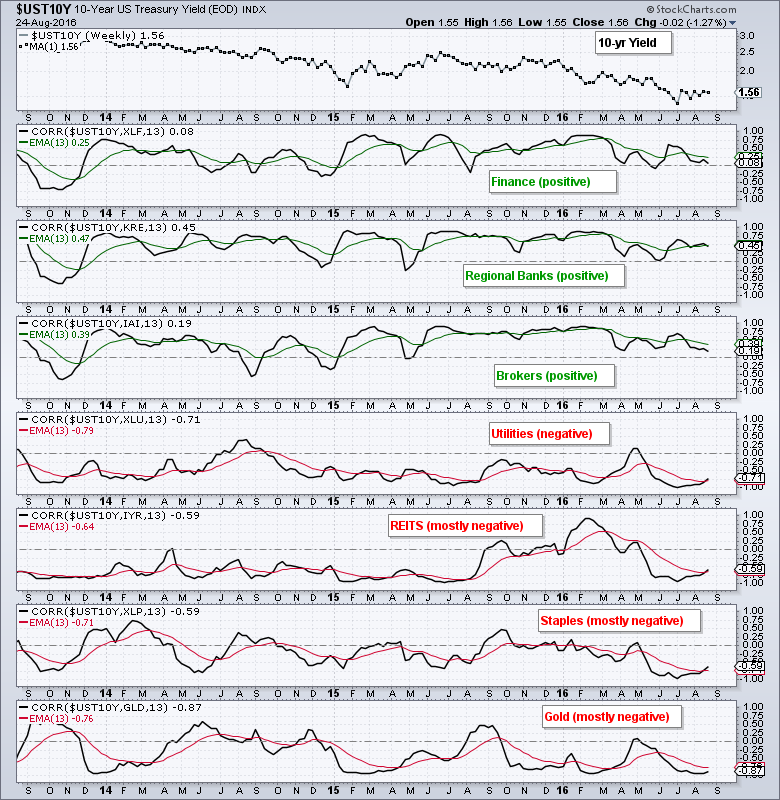
Whichever way Treasuries break, we can be sure that the effects will be felt throughout the financial markets. Gold, utilities, REITs and telecoms tend to be negatively correlated to the 10-YR Treasury Yield (and positively correlated to the 20+ YR T-Bond ETF). This means an upside breakout in the 10-yr Yield would be negative for gold, utilities and REITs, and a downside break would be positive. On the flipside, banks and brokers have been positively correlated to the 10-yr Yield. An upside break in the 10-yr would be bullish for banks and brokers, while a downside break would be negative.
US 10-yr Yields Sticks Out
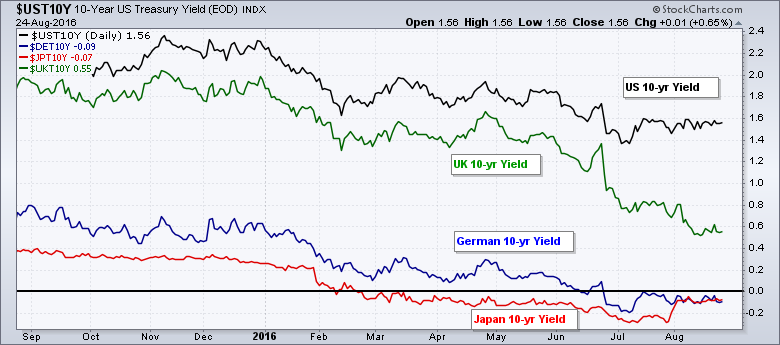
In a separate, but possibly, related note, the US 10-yr Yield is the highest of the big four and over twice as high as the UK 10-yr Yield. Notice that the German 10-yr Yield has been negative since late June and the Japanese 10-yr Yield have been negative since February. The US is still the only big Treasury market with some yield and may continue to attract foreign buyers as long as these big differentials remain.
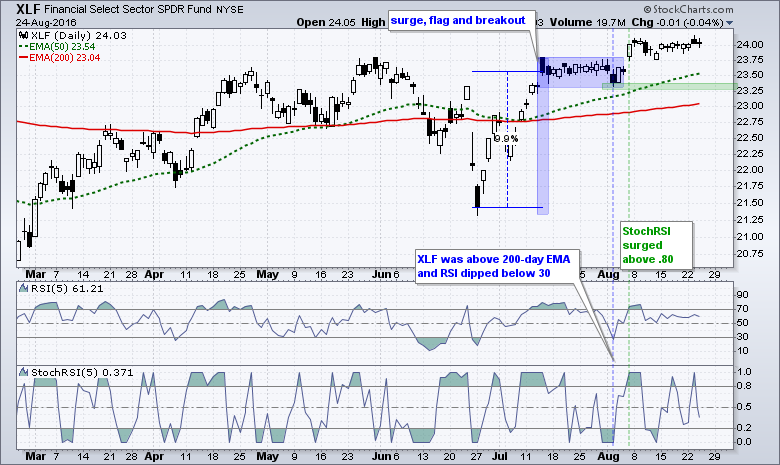
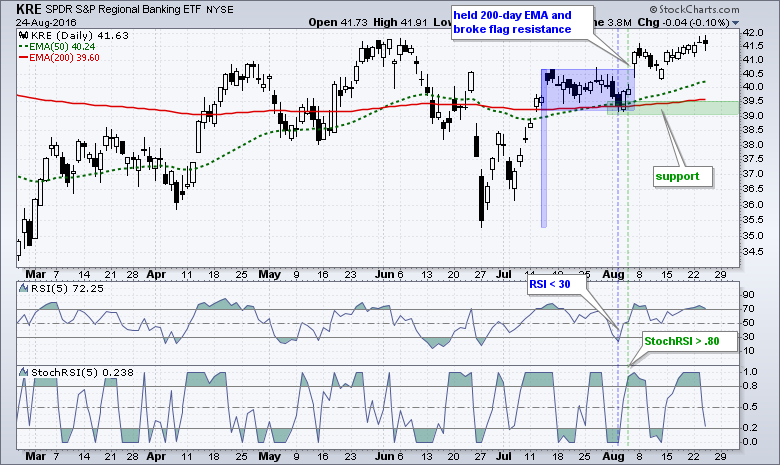
XLF and KRE Maintain Breakouts
The Finance SPDR (XLF) and the Regional Bank SPDR (KRE) became oversold in early August when RSI(5) dipped below 30 and broke flag resistance on August 5th. Even though upside has been limited since the flag breakouts, the breakouts are holding and the picture is more bullish than bearish. The flag lows mark first support. Also notice that the 50-day EMAs are above the 200-day EMAs on both charts, and both EMAs are rising.
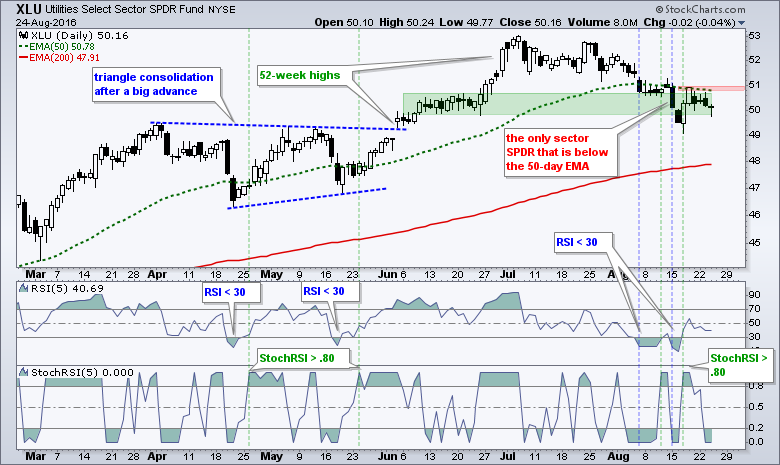
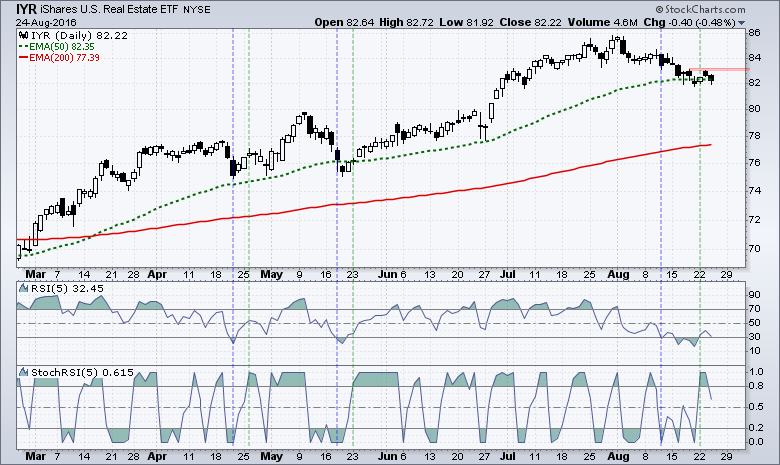
XLU and IYR Forge Bullish Setups
The Utilities SPDR (XLU) is one the weakest of the nine sector SPDRs because it is the only one trading below its 50-day EMA. The long-term trend, however, remains up because the 50-day EMA is above the 200-day EMA and the ETF hit a 52-week high less than two months ago. The indicator windows focus on the RSI(5) strategy that was presented in a System Trader article. Basically, buy when the bigger trend is up and RSI(5) dips below 30. Sell when RSI(5) moves above 70. RSI(5) dipped below 30 twice in August for the old double dip. Thus, I am watching the price chart closely for an upside breakout at 51. The second chart shows the REIT iShares (IYR) with a similar setup in the works. Careful here: These two could be affected by a move in the Treasury market.
Gold Breaks, but Becomes Oversold
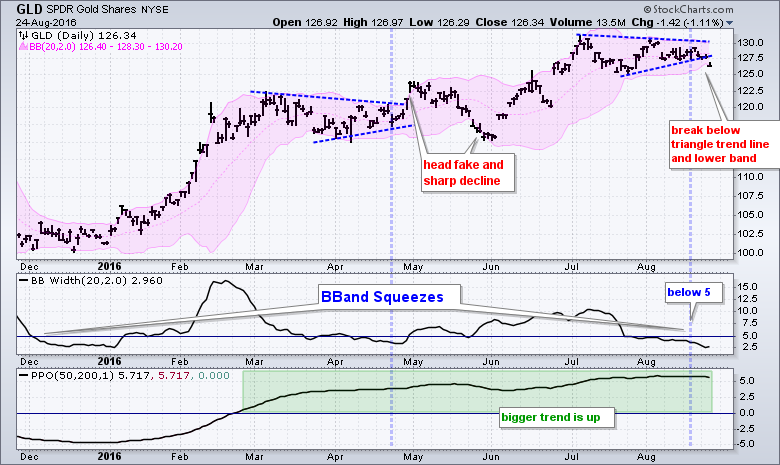
Gold is between a rock and a hard place - as it usually is when in its raw state. I showed the Gold SPDR (GLD) with a Bollinger Band squeeze on Tuesday and the ETF broke below the lower band on Wednesday. This is short-term bearish, but the long-term trend remains up for bullion and I typically just ignore short-term bearish signals when the bigger trend is up. Such a move can be used to trigger stops, but I do not consider short positions when the bigger trend is up.
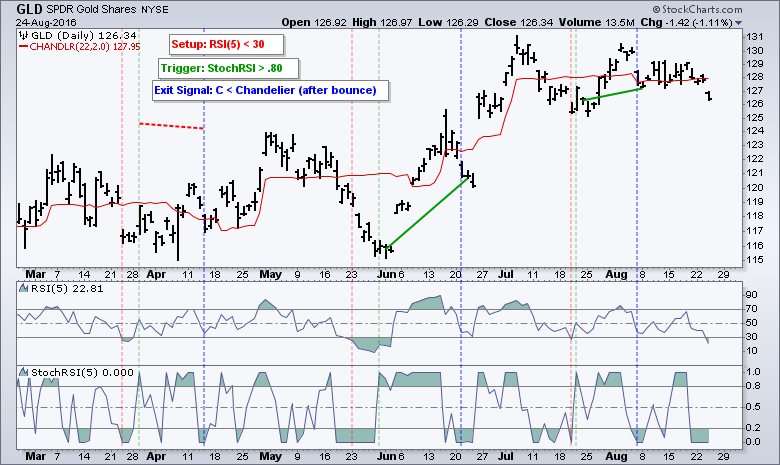
There are a gazillion indicators and trading systems out there. Throw in different timeframes and this means we can pretty much see whatever we want to see on a chart. GLD broke the lower Bollinger Band and that is considered short-term bearish. However, the next chart shows RSI(5) dipping below 30 for a bullish setup. The last three setup-trigger-exit sequences are also shown on the chart below. The red line shows when RSI(5) dips below 30 for a bullish setup. The green line shows when StochRSI(5) moves above .80 for a trigger. The blue line shows when GLD closes below the Chandelier Exit (22,2). Note this means GLD must first move above the Chandelier Exit. There were three completed trades over the last six months: one loss and two profits. GLD has another setup working, but StochRSI(5) needs to exceed .80 for a signal.
******************************************************
Measuring Risk On-Risk Off - Using charts to quantify stock, economic and credit risk.
PPO Trading Strategy - How to use 3 PPOs to develop a trend-reversion trading strategy.
Long-term Trend Indicators - Using the PPO, EMA Slope and CCI to determine the trend.
ETF Master ChartPack - 300+ ETFs organized in a Master ChartList and in individual groups.
Follow me on Twitter @arthurhill - Keep up with my 140 character commentaries.
****************************************
Thanks for tuning in and have a good day!
--Arthur Hill CMT
Plan your Trade and Trade your Plan
*****************************************


