SPY Holds Triangle Break .... Testing the Mean-Reversion Strategy with IWM and QQQ .... IWM Gaps towards Big Support Zone .... QQQ Remains with Active RSI Signal .... Do Stops Matter? .... Consumer Discretionary Sector Teeters .... Sector Trend and Breadth Table .... //// ....
SPY Holds Triangle Break
I covered the major stock indexes and broad market breadth indicators are Saturday. The bullish signals are still active and I have yet to see bearish signals to change my opinion that we are still in a bull market environment. The S&P 500 is clearly undergoing some sort of correction because it has drifted lower the last two months. Despite this downward drift, the index is still less than 3% from its all time high. In addition, the index is above the rising 200-day EMA and the 50-day EMA is above the 200-day EMA. The correction could extend further and I am marking key support in the 2100-2120 area (208-210 on the SPY chart).
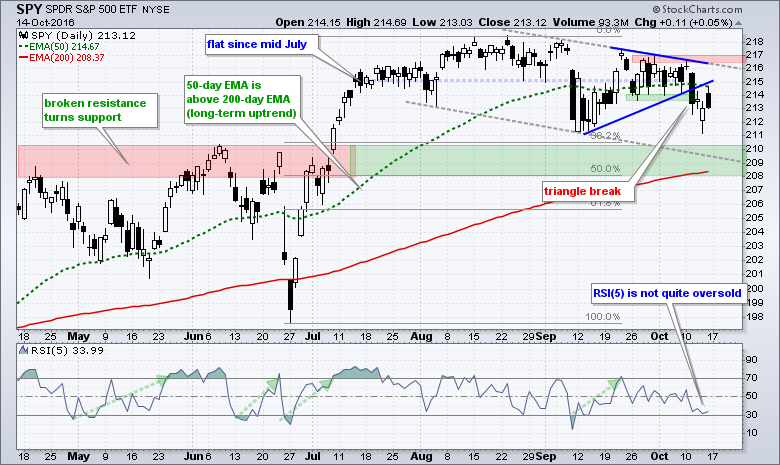
The chart above shows SPY breaking triangle support last Tuesday and holding this breakdown. Stocks reversed course intraday on Thursday and opened strong on Friday, but closed weak as SPY formed a black (filled) candlestick. The gray trend lines mark a potential falling channel with a downside target around 209. This area also marks a potential reversal zone based on broken resistance, the rising 200-day EMA and the 38-50% retracement zone. Picking reversal zones is not an exact science. This is why I look for more than one confirming indicator and use zones instead of exact levels. A move into the reversal zone and an RSI dip below 30 would definitely pique my interest. The indicator window shows 5-day RSI just above 30. A move below 30 would signal short-term oversold conditions that would set up a mean-reversion trade. Mean-reversion systems go long when the bigger trend is up and the ETF becomes short-term oversold (RSI<30).
Testing the Mean-Reversion Strategy with IWM and QQQ
IWM tests very good for the 5-day RSI mean-reversion strategy and QQQ tests good for the 10-day RSI mean-reversion strategy. To recap, the mean-reversion strategy buys when the S&P 500 is in a long-term uptrend and RSI moves below 30. There is NO stop-loss and the exit triggers when RSI moves above 70. The tables below show the results when testing QQQ and IWM using 5-day RSI and 10-day RSI.
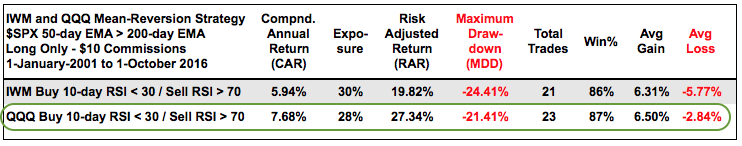
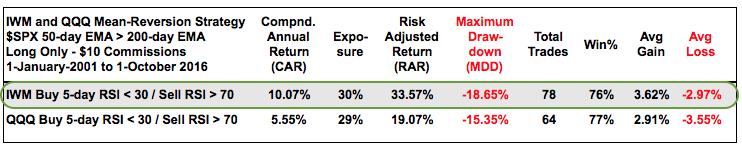
Here are the key takeaways:
- The Maximum Drawdown is much better with 5-day RSI (less risky)
- There are many more trades using 5-day RSI (more active)
- IWM tests better with 5-day RSI (10% Compound Annual Return)
- QQQ tests better with 10-day RSI (7.68% Compound Annual Return)
- The Risk-adjusted Returns are very high for both systems
- The Win% for both systems is 76% or higher
IWM Gaps towards Big Support Zone
The chart below shows IWM with 5-day RSI and the last four buy signals marked with green arrows. I would like to point out the buy signal on June 17th. The system generates a signal on the close and the entry is based on the next open. This system went long on the open on June 18th and did not exit until the sell signal on July 8th. This means one would have endured the Brexit dip without an exit or stop-loss. This would have been tough, but system trading means taking the signals and sticking with the system.
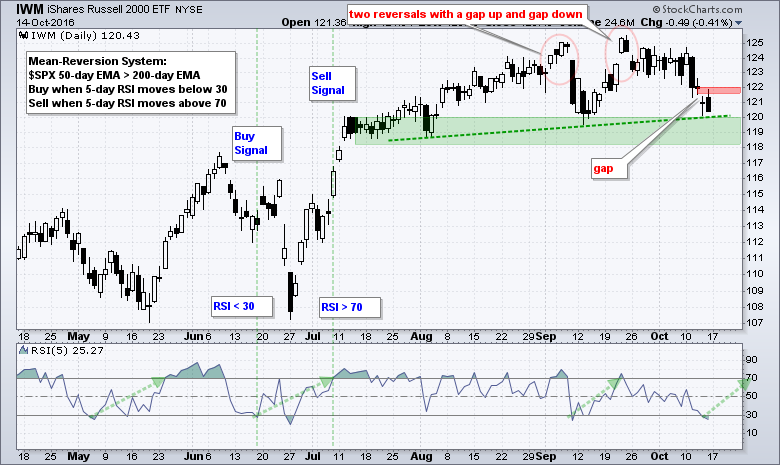
Returning to some basic chart analysis, IWM gapped down on Thursday and the ETF is poised to test a support zone in the 118-120 area. Filling the gap is the first step to a bullish reversal here and breakout players can watch for a close above 122.
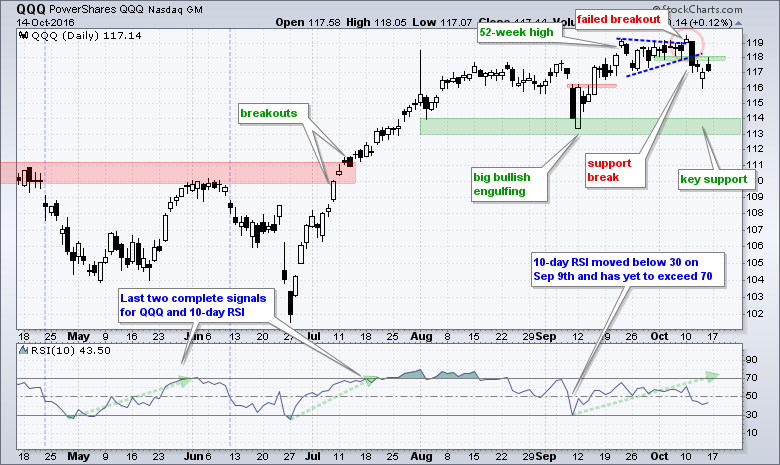
QQQ Remains with Active RSI Signal
The next chart shows QQQ with two completed trades based on 10-day RSI. 10-day RSI dipped below 30 on Sept 9th for another signal, but has yet to exceed 70 for an exit signal. As the Maximum Drawdowns show, 10-day RSI is a riskier mean-reversion system than 5-day RSI. Why? Because 10-day RSI does not exceed 30 or 70 as often - and this means traders are exposed longer for each trade. 10-day RSI will exceed 70 at some point in the future, but I do not know when. I do know that 5-day RSI will exceed 70 before 10-day RSI does.
Do Stops Matter?
Texas readers should note that Cesar Alvarez of AlvarezQuantTrading.com will be speaking in Austin and Dallas the next two days. Cesar will speak at an MTA meeting in Austin on October 17th at 6PM and at an AFTA meeting in Dallas on October 18th at 6:30PM. Cesar's will be speaking on stops and position sizing. Give him my regards if you happen to go.
Consumer Discretionary Sector Teeters
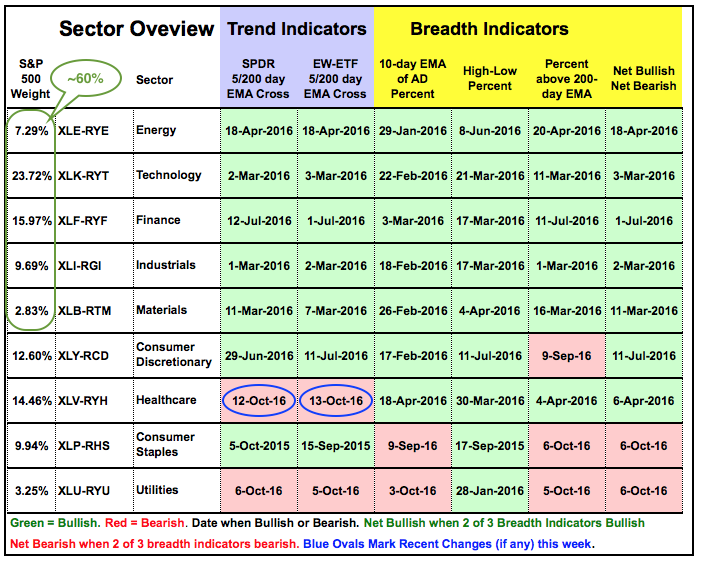
The next table summarizes the trend and breadth indicators for the nine sectors. The trend is based on the 5-day EMA and 200-day EMA for the sector SPDR and the equal-weight sector ETF. The breadth indicators are the same three used on the major stock indexes. The 10-day EMA of AD Percent is bullish after a move above +30% and bearish after a move below -30%. High-Low Percent turns bullish when it exceeds +10% and turns bearish when it moves below -10%. The %Above 200-day EMA triggers bullish on a move above 60% and bearish on a move below 40%. The breadth indicators are Net Bullish when at least two of the three are on bull signals, and Net Bearish when at least two of the three are on bear signals.
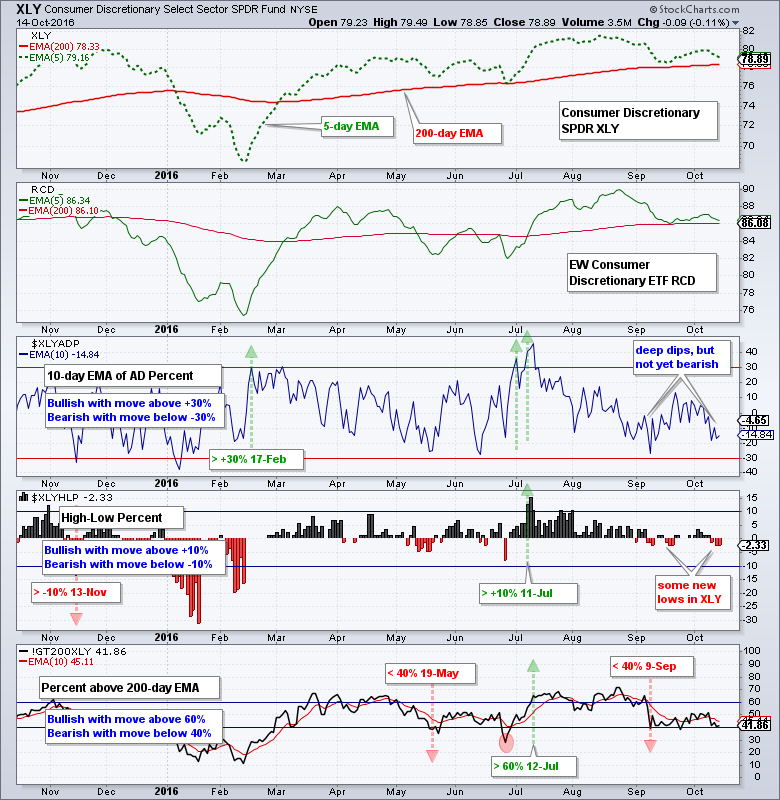
The chart above shows the consumer discretionary sector with the key indicators. The 5-day EMAs for XLY and RCD are just above their 200-day EMAs. It would not take much to push these two into downtrends. The 10-day EMA for XLY AD Percent ($XLYADP) is currently negative (-14.84%), but it has yet to reverse the bullish signal from February 17th. High-Low Percent triggered bullish on July 11th. Even though Consumer Discretionary High-Low% ($XLYHLP) has not exceeded +5% since mid August, new lows have yet to significantly expand to trigger a bearish signal. XLY %Above 200-day EMA (!GT200XLY) triggered bearish on 9-Sep and remains in bear mode. This means 1 of the 3 breadth indicators are bearish (or 2 of 3 are still bullish). The other two indicators are not far from bearish signals, but I will wait for the signals to materialize before turning bearish on this sector.
Sector Trend and Breadth Table
The table below summarizes the signals for all nine sectors and five of the nine are completely green (bullish). At this point, I do not see a bear market because technology, industrials and finance are holding up. The trouble will start if/when we see bearish signals appear in these three offensive sectors. Energy and materials are also entirely green. Together, the top five sectors account for 60% of the S&P 500 and this is enough strength to keep the market afloat. The bearish indicators (red) start to appear with the consumer discretionary, healthcare, consumer staples and utilities sectors. These four sectors account for 40% of the S&P 500. You can see all nine sector breadth charts in my ChartList (click here). I will also add the index breadth charts and the risk ratios.
******************************************************
Measuring Risk On-Risk Off - Using charts to quantify stock, economic and credit risk.
PPO Trading Strategy - How to use 3 PPOs to develop a trend-reversion trading strategy.
Long-term Trend Indicators - Using the PPO, EMA Slope and CCI to determine the trend.
ETF Master ChartPack - 300+ ETFs organized in a Master ChartList and in individual groups.
Follow me on Twitter @arthurhill - Keep up with my 140 character commentaries.
****************************************
Thanks for tuning in and have a good day!
--Arthur Hill CMT
Plan your Trade and Trade your Plan
*****************************************


