Using Breadth to Determine a Long-term Bias .... Short-term Breadth Indicators Become Oversold .... The 800-pound Gorilla in the Room .... Six of Nine Sectors Remain with Long-term Bullish Signals .... Revisiting the RSI Mean-Reversion System for SPY .... SPY Breaks Triangle Trend Line .... Further Study .... //// ....
Using Breadth to Determine a Long-term Bias
My long-term indicators remain in bull mode, but the short-term trends have turned down for the major index ETFs and six of the nine sectors. Even though this means the stock market is short-term bearish right now, a pullback at this stage is actually quite normal and I would view it as a correction within a bigger uptrend. I will review the long-term trends and breadth indicators on Monday when I have full weekly data for the charts.
In the meantime, I will start with two breadth indicators we can use to confirm the long-term trend and identify short-term overbought/oversold conditions. The first chart shows the percentage of stocks above the 200-day EMA for four major stock indexes. A move above 60% shows broad enough upside participation to turn long-term bullish, while a move below 40% shows broad enough downside participation to turn long-term bearish. I do not use 50% for signals because there would be too many whipsaws.
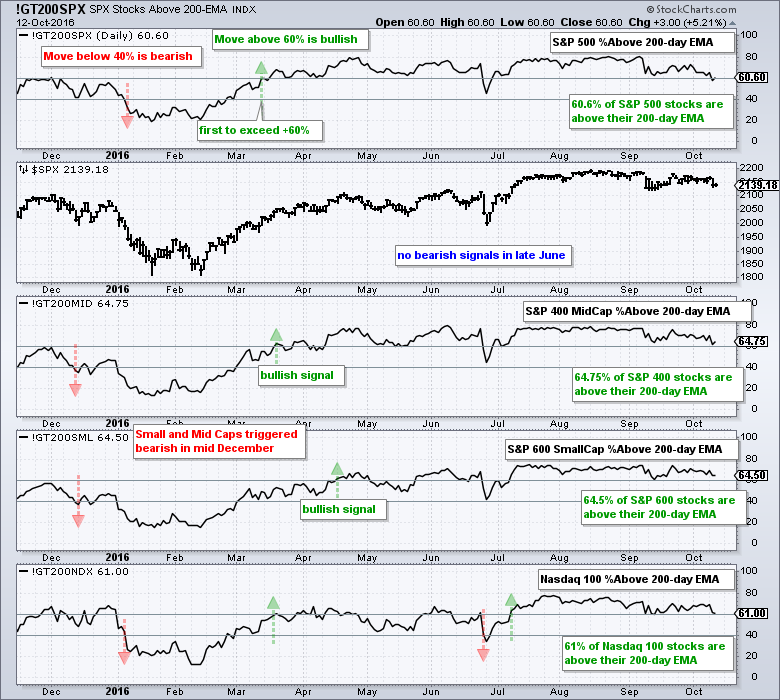
I am mainly focused on the S&P 500, S&P MidCap 400 and S&P Small-Cap 600 for the broader market. The Nasdaq 100 is at the bottom for reference. The red arrows on the far left show when the S&P MidCap 400 and S&P Small-Cap 600 triggered bearish signals in mid December and these signals preceded the January decline. The S&P 500 and S&P MidCap 400 were the first to turn bullish with signals in mid March (green arrows). Small-caps joined in later with a bullish signal in mid April. Notice that there were no bearish signals in late June during the Brexit panic. As the chart now stands, mid-caps and small-caps are stronger than large-caps. The Mid-Cap %Above 200-day EMA (!GT200MID) and Small-Cap %Above 200-day EMA (!GT200SML) are around 65% and the S&P 500 %Above 200-day EMA (!GT200SPX) is near 60%. All three are quite a ways from a bearish signal.
Short-term Breadth Indicators Become Oversold
Establishing the long-term bias is the first step to short-term trading. Note that I only use short-term and long-term for timeframes. The short-term can be measured in days and weeks. The long-term can be measured in weeks and months. In general, I prefer mean-reversion strategies for short-term trading (as opposed to breakout strategies). This means I look for short-term oversold conditions when the long-term trend or indicators are bullish.
Using the Percent Above 200-day EMA indicators, we have established a bullish bias since March for $SPX and $MID, and since April for $SML. We can now turn to the Percent Above 20-day EMA to identify short-term oversold conditions that may provide opportunities. This indicator becomes oversold with a move below 30 (green ovals). Notice that the S&P 500 and Nasdaq 100 are already oversold, but the S&P MidCap 400 and S&P Small-Cap 600 have yet to become oversold. They are holding up better.
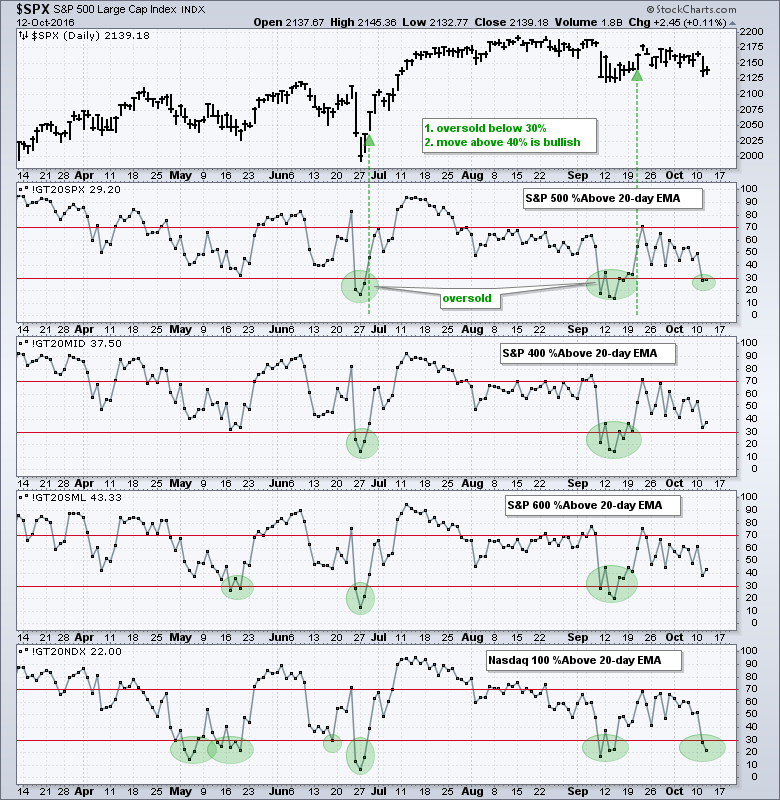
There are two ways to approach mean-reversion trading. First, traders can simply buy when there is a short-term oversold signal and the long-term trend/indicator is bullish. This means buying on the move below 30. Second, traders can wait for some sort of upturn or sign that the market is turning. Either way, there are NO GUARANTEES. Those looking for an upturn can wait for the indicator to move above 40%. The last two signals for the S&P 500 are shown with the green arrows.
The 800-pound Gorilla in the Room
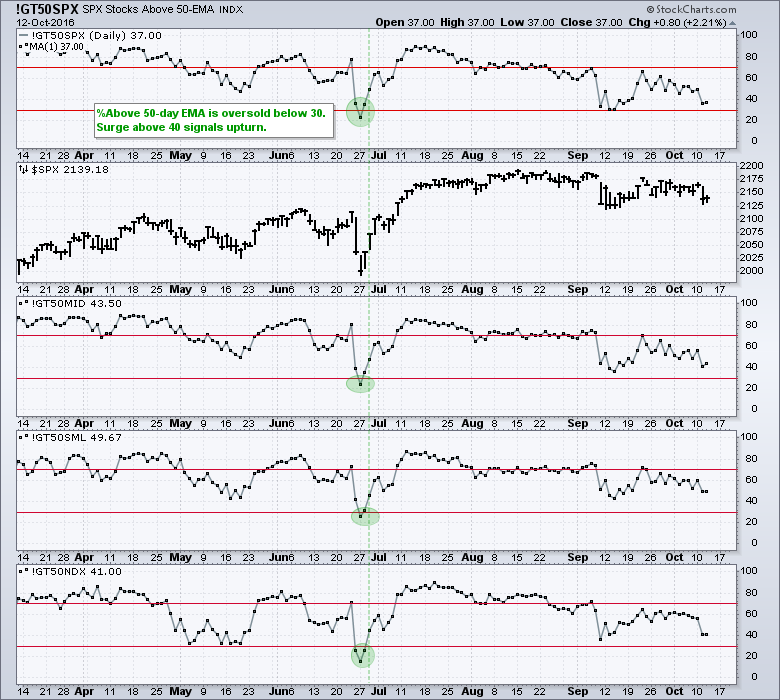
Even though I prefer short-term indicators, sometimes corrections extend further than expected and short-term indicators remain oversold. The election remains the biggest threat to volatility and there are a little less than four weeks remaining until election day. This means we could see further volatility and a deeper correction. The next chart shows the %Above 50-day EMA for the same indexes, which measure a medium-term timeframe between 20 day and 200 days. These indicators became oversold with the Brexit panic and surged above 40% two days later. Thus, chartists may also want to keep this indicator on their radar in the coming days and weeks.
Six of Nine Sectors Remain with Long-term Bullish Signals
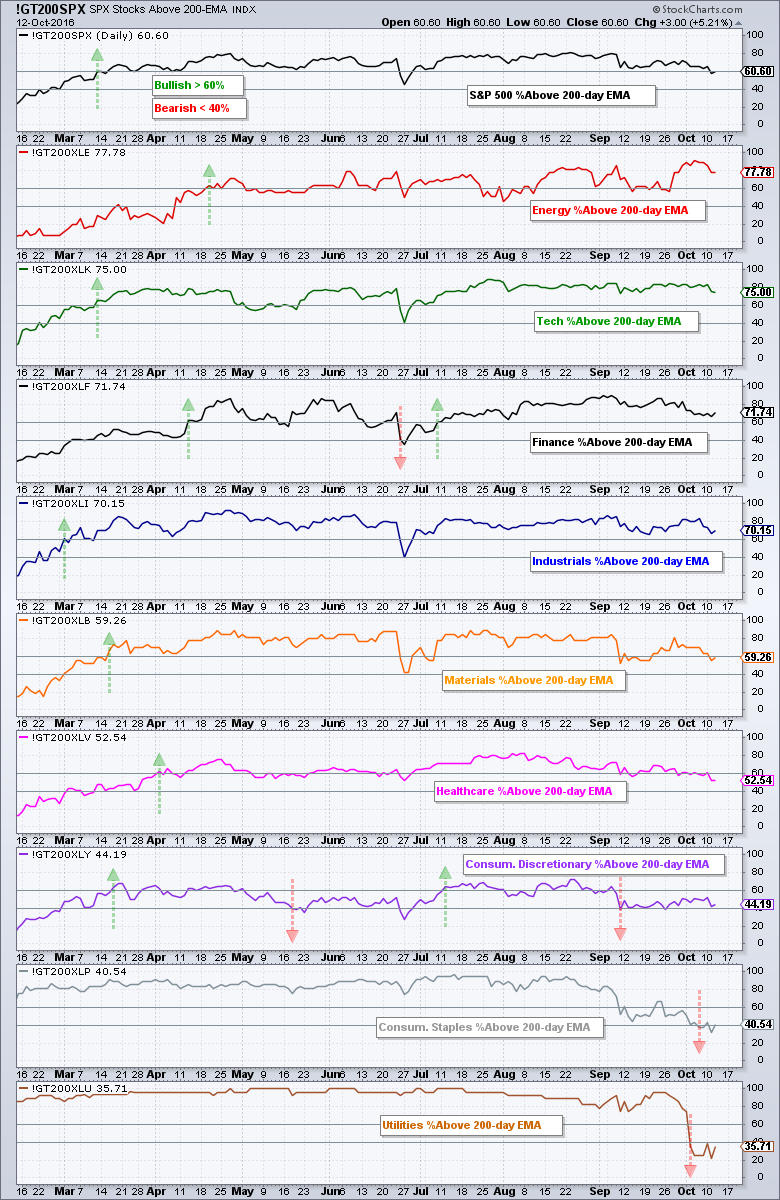
The next chart shows %Above 200-day EMA for the S&P 500 and the nine sectors. The S&P 500 is at the top and the windows are sorted from strongest to weakest. Energy, technology, finance and industrials are the strongest with readings at 70% or higher. These four represent 51% of the S&P 500 and the market can at least tread water as long as these four remain strong. Consumer discretionary, consumer staples and utilities are the weakest with readings below 45%. These three represent 25% of the market and they triggered bearish signals with moves below 40% in September/October (red arrows). Thus, one quarter of the market has turned bearish. The trouble for the broader market starts when two more of the other sectors trigger bearish signals because this would put four of the five on bearish footing. You can also chart the %Above 20-day EMA for the nine sectors (click here for a chart).
Revisiting the RSI Mean-Reversion System for SPY
RSI could become oversold in the coming days and this means a classic mean-reversion setup could materialize. It is sometimes tough and counter-intuitive to trade a mean-reversion system, but it is hard to argue with the backtest results. The system below trades long positions only and looks for bullish setups only when the 50-day EMA is above the 200-day EMA (the long-term trend is up). The system goes long with RSI moves below 30 and exits when RSI moves above 70. I have tried different trailing stops, but they just reduce returns and increase drawdowns. Maybe one day I will find a good one, but for now I will just exit when RSI moves above 70.
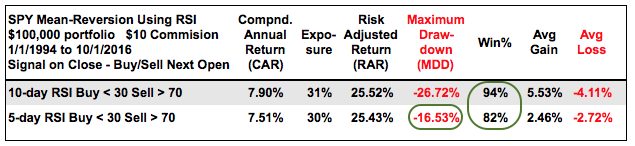
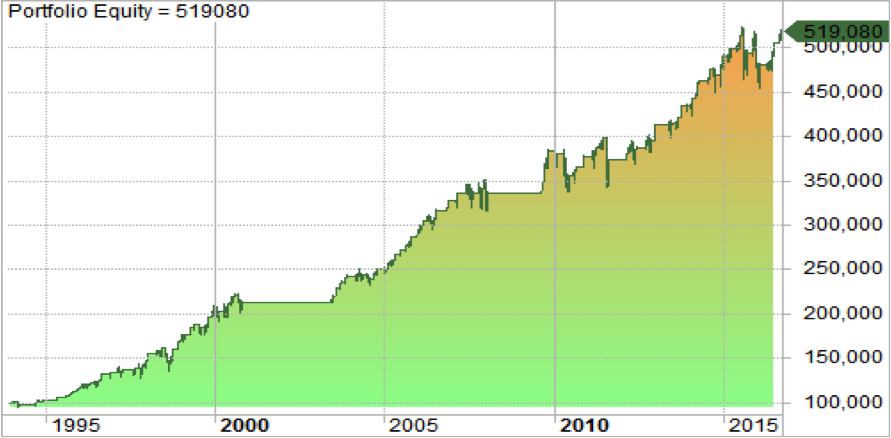
As the table above shows, both systems returned over 7% and were exposed to the market just 30% of the time, which resulted in a very high Risk-adjusted Return (~25.5%). Both systems also experienced a higher win rate (> 80%). The Maximum Drawdown was much less for 5-day RSI and this is a big plus. It is much easier for 5-day RSI to reach signal levels than 10-day RSI. Even if you don't trade the system, there is some valuable information here. First, mean-reversion system show good results in backtesting. Second, it is possible to buy the falling knife and make money. Third, you don't need stops, but you do need an exit plan. The image below shows the equity line (profit-loss) for this strategy.
SPY Breaks Triangle Trend Line
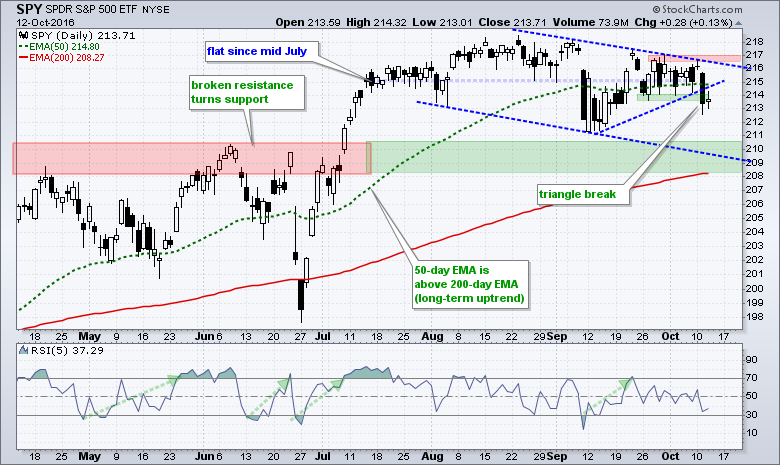
The chart below shows SPY with 5-day RSI still above 30 and we have yet to get a mean-reversion setup. On the price chart, the index broke triangle support on Tuesday and this break is holding. I drew a trend line parallel to the upper trend line and it extends to the 209 area. There is a lot of (subjective) support in the 208-210 area from broken resistance and the rising 200-day EMA. Should the decline continue, this is an area to watch for a bounce.
Further Study
These trading strategies were tested using Amibroker with the help of Cesar Alvarez of AlvarezQuantTrading.com. For more information about his testing and consulting services, click here.
******************************************************
Measuring Risk On-Risk Off - Using charts to quantify stock, economic and credit risk.
PPO Trading Strategy - How to use 3 PPOs to develop a trend-reversion trading strategy.
Long-term Trend Indicators - Using the PPO, EMA Slope and CCI to determine the trend.
ETF Master ChartPack - 300+ ETFs organized in a Master ChartList and in individual groups.
Follow me on Twitter @arthurhill - Keep up with my 140 character commentaries.
****************************************
Thanks for tuning in and have a good day!
--Arthur Hill CMT
Plan your Trade and Trade your Plan
*****************************************


