.... Steady Uptrends for Six Homebuilder Stocks
.... Flags, Throwbacks and Diamonds (plus DHI)
.... Several Asia Markets Hit New Highs
.... Philippines, Malaysia and Indonesia ETFs Turn Up ....
Steady Uptrends for Six Homebuilder Stocks
CandleGlance charts are great for comparing price charts of related stocks. Chartists can enter up to 12 symbols in the symbol entry box at the top of most StockCharts pages. Select "CandleGlance" and then click "Go" to create the charts. You can even apply a "Custom Style" to these charts by creating a ChartStyle and naming it candleglance. Here is a "how to" article from our crack support team. I am showing my CandleGlance charts as one-year line charts with a 50-day EMA and 200-day EMA.
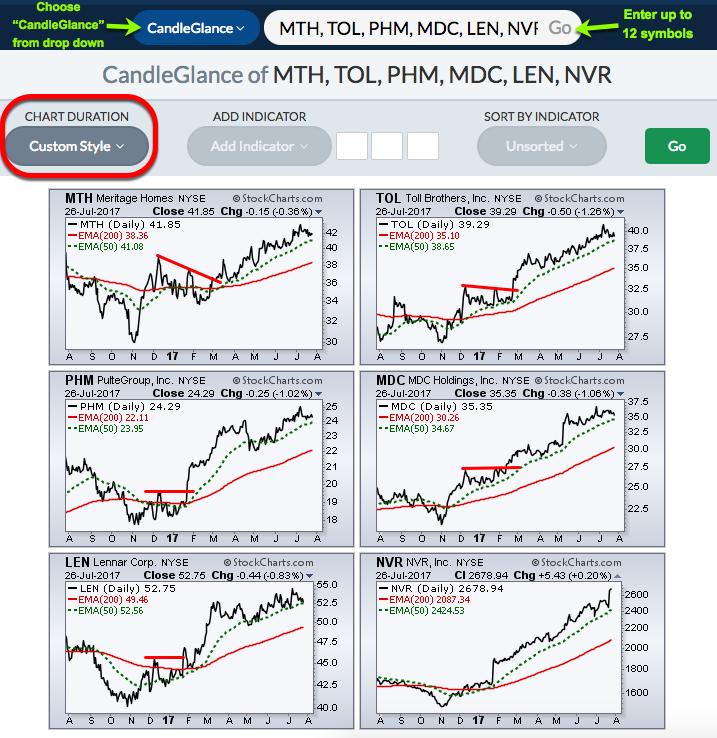
The chart above shows six home builders in clear uptrends. The first five pulled back over the past week or so, but NVR surged to a new high this week. Note that all six hit new highs over the last two weeks. The main takeaway here is that the homebuilders are trending higher and this is positive for the market. At this stage, a move below the 50-day EMA would signal a pullback within the uptrends and could provide an entry point within the bigger uptrend.
Flags, Throwbacks and Diamonds (plus DHI)
The next chart shows DR Horton (DHI) forming a flag within a bigger uptrend. A breakout at 37 would signal a continuation higher. There are two items worth noting for future reference (learning). The first is the classic breakout and throwback in January-February. DHI broke out with a gap and big surge and then fell back to the breakout zone. This "throwback" gave traders a second chance to get into the trade.
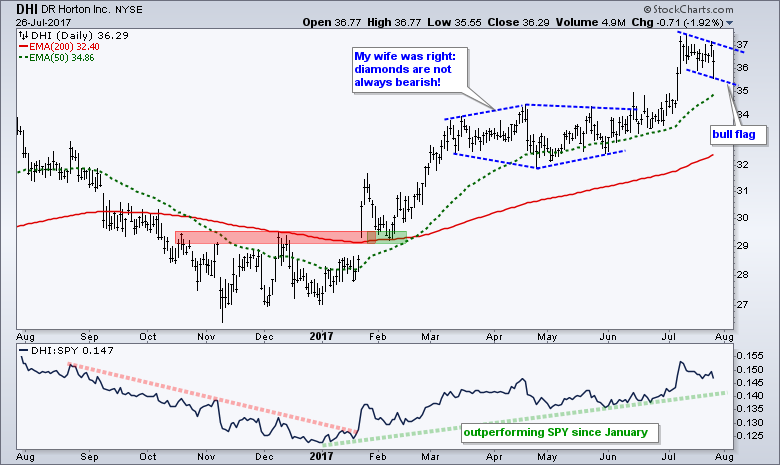
The second item is the diamond pattern from March to early June. These are usually considered bearish reversal patterns, but I do not buy into this theory. A diamond is just a consolidation after an advance and consolidations within uptrends are typically bullish continuation patterns (not reversals). Moreover, the middle of the pattern usually marks a multi-month high and the right half is a symmetrical triangle, which is a continuation pattern. To me, a triangle after a new high sounds more bullish than bearish. Personally, I try to ignore diamond patterns and focus on patterns that match up with the bigger trend. In other words, I prefer to bet on trend continuations, not trend reversals.
Several Asia Markets Hit New Highs
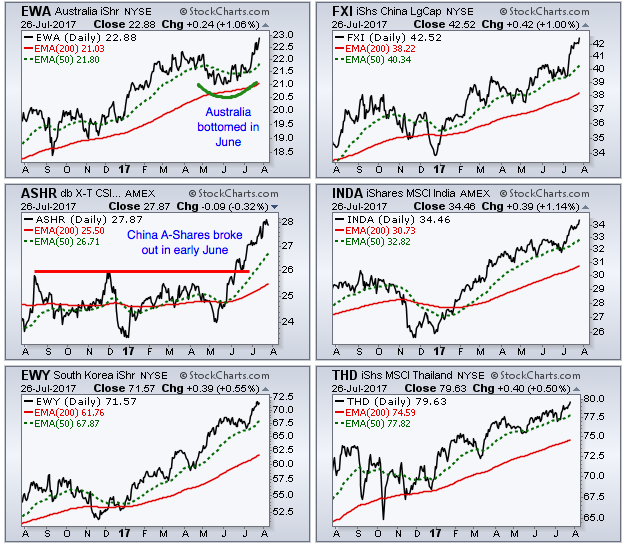
There are a lot of new highs in the broad market Asian ETFs and the Emerging Markets ETF (EEM) is also at a new high. As noted by John Murphy recently, the weak Dollar is boosting emerging market currencies and their stock markets are following their currencies higher. The CandleGlance chart below shows ETFs for Australia, China Large-cap, China A-Shares, India, South Korea and Thailand hitting new highs over the past week. The green dashed line is the 50-day EMA and the red line is the 200-day EMA.
Philippines, Malaysia and Indonesia iShares Turn Up
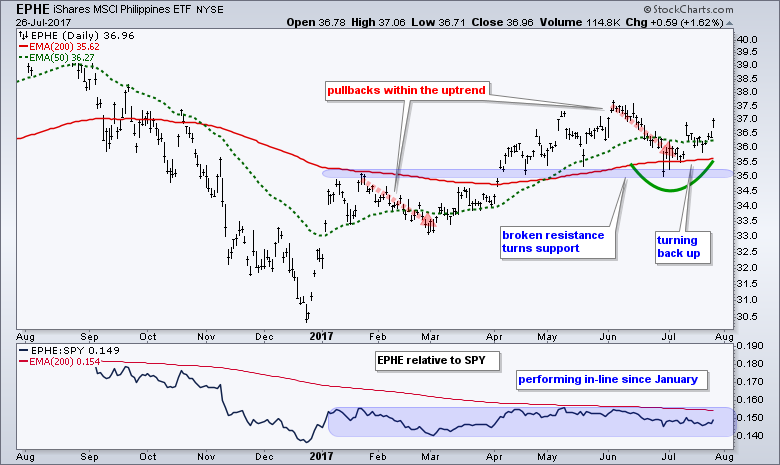
There is clearly a theme at work in the global markets: strong Asia and weak Dollar. One never knows how long a theme will play out, but it is working now and this means I am looking at other emerging market ETFs for bullish setups. The next three charts show Asian ETFs that appear to be where EWA (above) was in mid-late June (turning up after a correction). The first chart shows the Philippines iShares (EPHE) with the 50-day EMA above the 200-day EMA and price bouncing off support in the 35 area. The June swoon looks like a correction within an uptrend and it appears that this correction is ending.
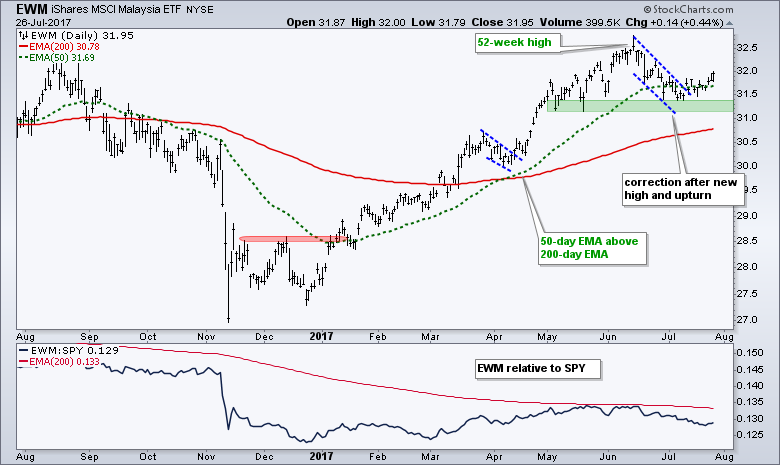
The next chart shows the Malaysian iShares (EWM) hitting a new high in mid June and pulling back with a correction into mid July. The ETF found support near the May lows and turned up over the last two weeks. It looks like the correction is ending and the uptrend is resuming.
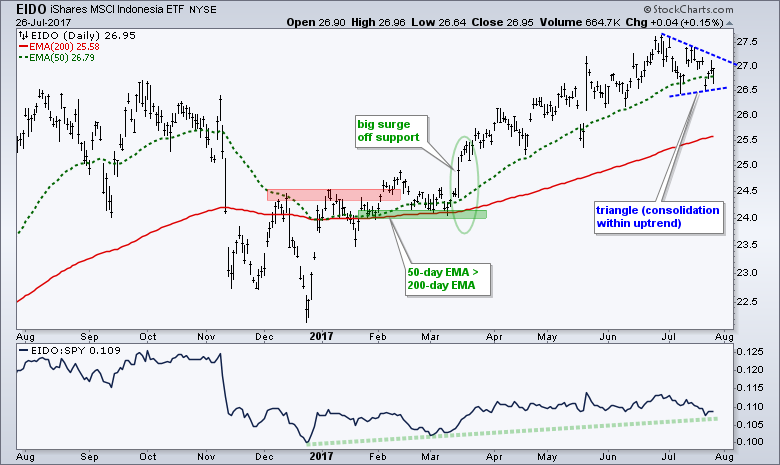
The third chart shows the Indonesia iShares (EIDO) hitting a new high in late June and then consolidating with a triangle. A consolidation within an uptrend is typically a bullish continuation pattern. Look for a breakout at 27.2 to signal a continuation higher.
******************************************************
ETF Master ChartPack - 300+ ETFs organized in a Master ChartList and in individual groups.
Follow me on Twitter @arthurhill - Keep up with my 140 character commentaries.
****************************************
Thanks for tuning in and have a good day!
--Arthur Hill CMT
Plan your Trade and Trade your Plan
*****************************************


