.... Health Care SPDR Renews its Breakout
.... Pfizer and Bristol-Meyers Bounce off Support
.... HACK and IGN Confirm Big Continuation Patterns
.... Cisco and Fortinet Lead their Groups
.... Copper Gets Oversold Bounce (plus COPX)
.... Tesla Surges off Support Zone
.... Short-term Ugliness with Long-term Bullishness ....
Health Care SPDR Renews its Breakout
The Health Care SPDR (XLV) is perking back up with a surge the last two days. Overall, the big trend is clearly up with a 52-week high in October. XLV then fell back to the breakout zone with a 50-61.8% retracement in November. Also notice that RSI became oversold and then formed a small positive divergence. The late November breakout at 82 ended this pullback and signaled a resumption of the bigger uptrend. There was then a small throwback to the mini breakout at 82 and upturn the last two days.
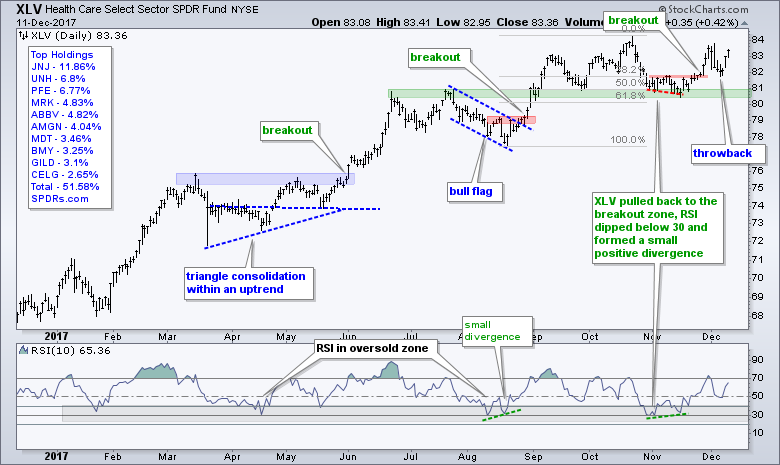
Note that I rarely use positive and negative divergences with momentum indicators. First and foremost, I ignore negative divergences that form with a new high or in a long-term uptrend. Why fight the bigger trend? I only use a positive divergence when it forms during a pullback or correction, such as with XLV above. The positive divergence, however, does not add much to the setup. The November decline was a pullback within a bigger uptrend, RSI became short-term oversold and the ETF broke mini resistance at 82. The setup and signal are there with or without the positive divergence.
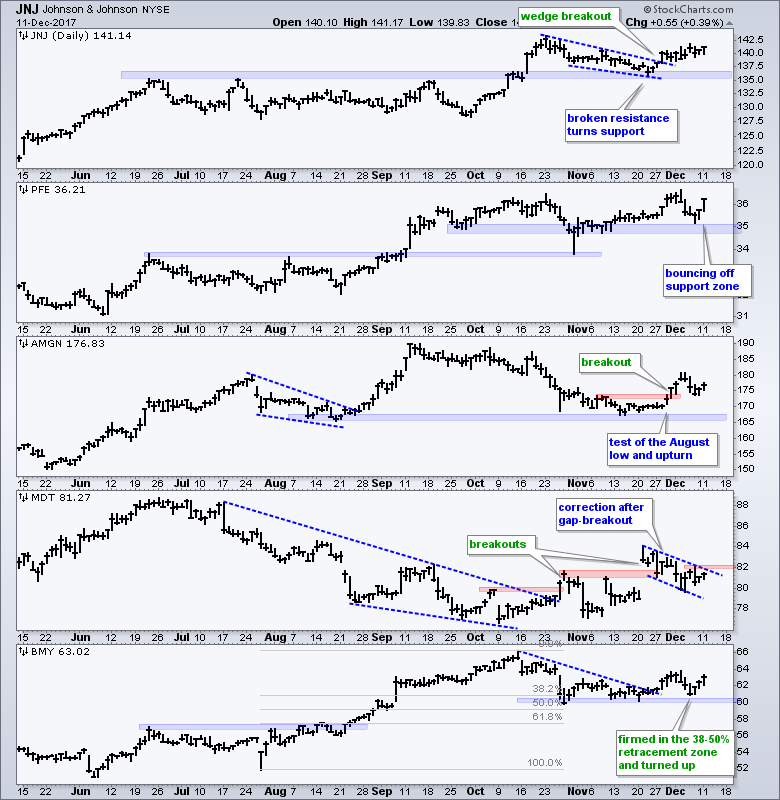
Pfizer and Bristol-Meyers Bounce off Support
The next chart shows five of the top ten stocks in the Health Care SPDR. Johnson & Johnson (JNJ) fell back to its breakout with a falling wedge and broke out in late November. Pfizer (PFE) broke out to new highs in September, stalled with support in the 35 area and turned up the last two days. Amgen (AMGN) held the August lows with an upturn last week. Medtronic (MDT) broke two resistance levels and then fell back with a flag the last few weeks. Look for a breakout at 82 to resume the newly established uptrend. Bristol-Meyers (BMY) retraced 38-50% of the July-October advance, firmed in the 60 area and turned up the last three days.
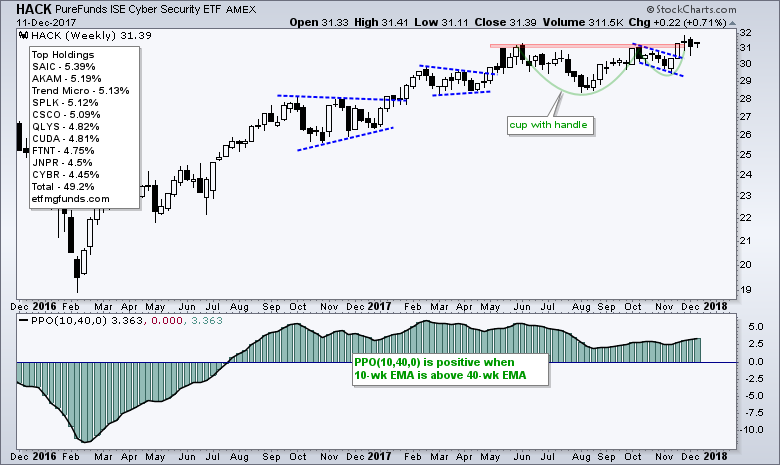
HACK and IGN Confirm Big Continuation Patterns
The Cyber Security ETF (HACK) led the market from February 2016 to May 2017 with a 60% advance and then moved into a sideways consolidation that looks like a cup-with-handle, which is a bullish continuation pattern popularized by William O'Neil of IBD. The October-November pullback formed the handle and the ETF broke out with a two-week surge above 31. This surge also recorded a new 52-week high. The nascent breakout could signal that HACK is poised to resume its leadership role in 2018.
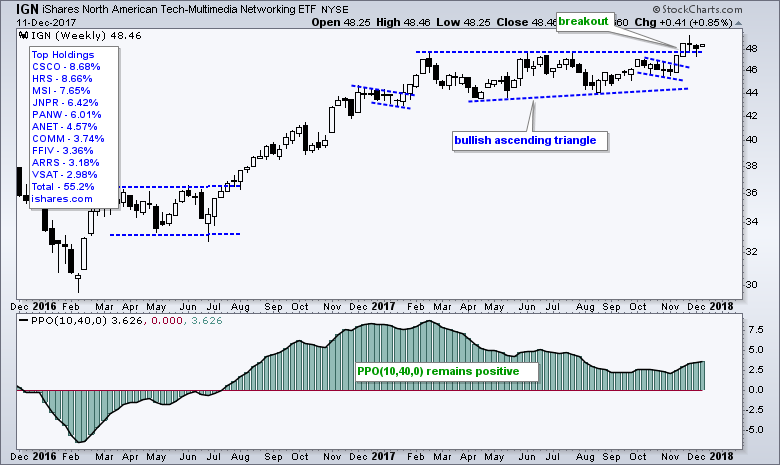
The Networking iShares (IGN) scored big gains from February 2016 to February 2017 and then moved into a holding pattern. An ascending triangle evolved over the next nine months and the ETF broke out with a surge in mid-November. This move also recorded a 52-week high, which means the long-term trend is clearly up. I could measure the height of the pattern for an upside target, but I am not a big fan of upside targets because I cannot predict the future. It (the chart) is what it is. The long-term trend is up and the breakout is bullish.
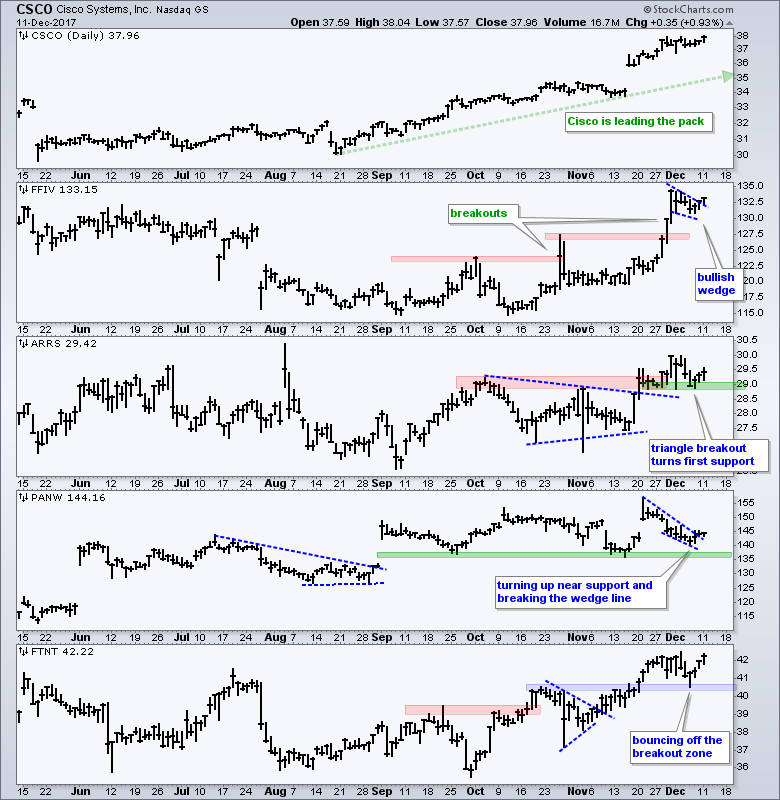
Cisco and Fortinet Lead their Groups
The next chart shows some stocks from IGN and HACK. Cisco (CSCO) accounts for almost 10% of the Networking iShares and this stock is leading the market with a string of new highs recently. F5 Networks (FFIV) broke above two resistance levels and then consolidated with a bullish wedge. It looks like the wedge is ending with a little breakout the last two days. Arris (ARRS) broke out in mid November and the breakout zone is turning into first support. Palo Alto Networks (PANW) fell back toward its support with a falling wedge and looks poised to break out of the wedge to continue its bigger uptrend. Fortinet (FTNT) tested the breakout zone with a dip last week and then bounced the last four days.
Copper Gets Oversold Bounce (plus COPX)
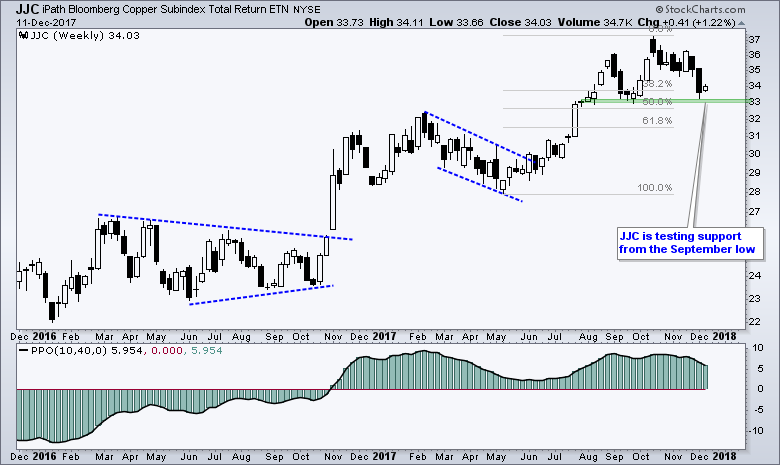
The Copper ETN (JJC) hit a 52-week high in November and then fell back to the September low over the last eight weeks. The overall trend is clearly up and this means the pullback is viewed as a mere correction. Nobody knows when this correction will end, but note that 10-day RSI (not shown) moved below 30 to become oversold for the first time this year. Copper is clearly at a moment-of-truth so chartists should be on guard for a bounce.
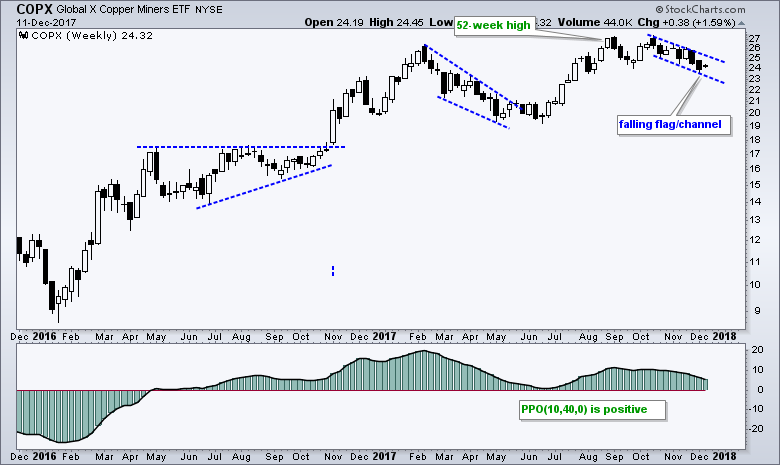
The next chart shows the Copper Miners ETF (COPX) with a falling flag or channel forming after a 52-week high. Again, this is a corrective pattern and a breakout would signal a continuation of the bigger uptrend.
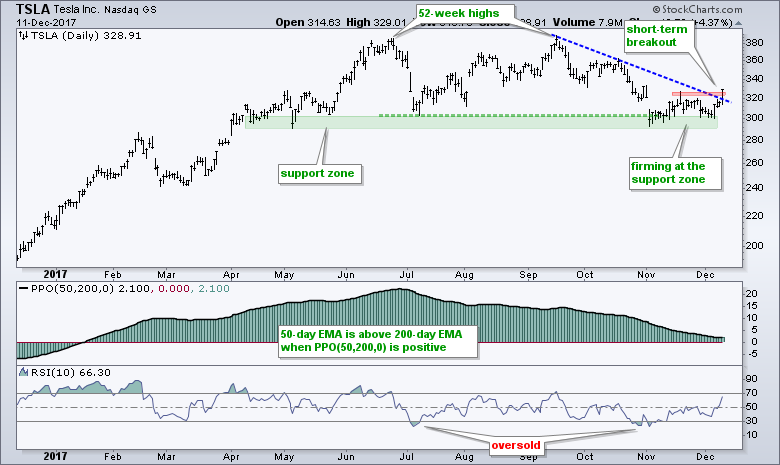
Tesla Surges off Support Zone
I featured Tesla (TSLA) two weeks ago as the stock tested the support zone in the 290-300 area. It looks like this test will be successful as the stock surged off support over the last four days and broke the mid November high.
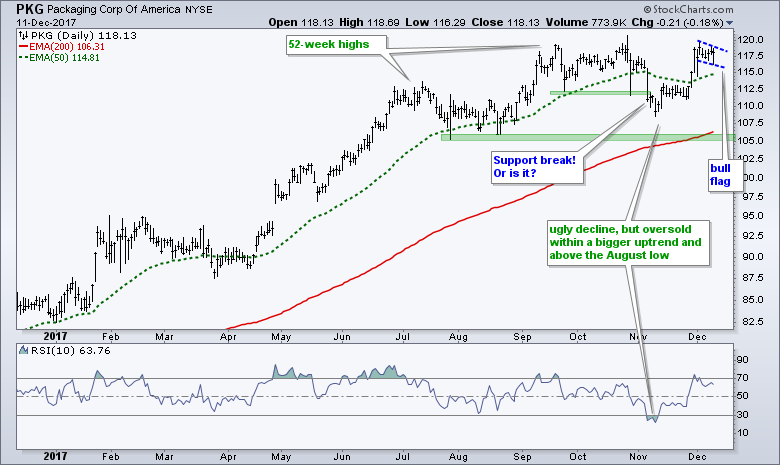
Short-term Ugliness with Long-term Bullishness
Packaging Corp of America (PKG) is a great example of short-term ugliness and long-term bullishness. The stock hit 52-week highs in summer and autumn, but suddenly fell with a sharp decline in November. This decline produced the first oversold reading of the year in RSI and appeared to break support from the Sep-Oct lows. Well, chartists with more perspective might not have been spooked. The 50-day EMA remained above the 200-day EMA and the stock did not even test the 200-day EMA. Despite short-term ugliness, the long-term uptrend never reversed. Flash-forward to this week and a bull flag is taking shape. A breakout at 119 would be short-term bullish and argue for a bigger break to new highs.
******************************************************
ETF Master ChartPack - 300+ ETFs organized in a Master ChartList and in individual groups.
Follow me on Twitter @arthurhill - Keep up with my 140 character commentaries.
****************************************
Thanks for tuning in and have a good day!
--Arthur Hill CMT
Plan your Trade and Trade your Plan
*****************************************


