.... QQQ Diverges from SPY Again
.... Mid-caps Shine on PerfChart
.... Candlesticks versus Closing Prices
.... Bonds and Dollar Push-Pull Gold
.... IDXX Breaks Flag Resistance
.... EBAY Bids to End Correction
.... Ball Corp Surges off Support Zone ....
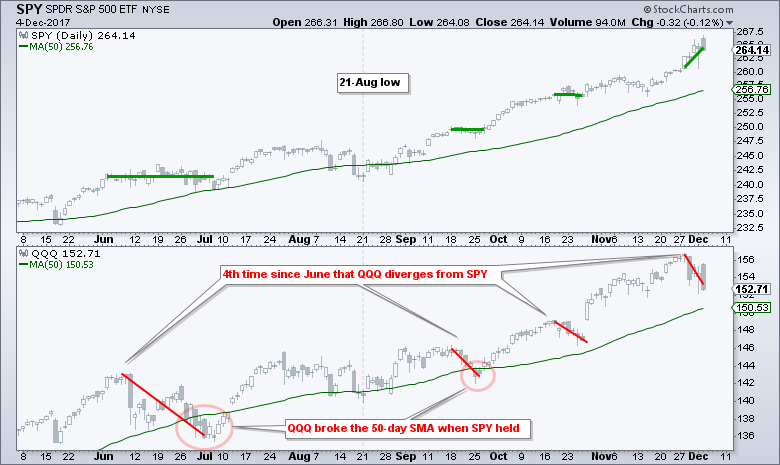
QQQ Diverges from SPY Again
QQQ diverged from SPY over the last few days and this marks the fourth divergence since June. The chart below shows QQQ falling four times (red lines) when SPY held firm or advanced (green lines). The June divergence lasted a few weeks and was quite deep. The September and October divergences were short-lived as QQQ regained its footing after a few days and moved to new highs. With the long-filled candlesticks in QQQ over the last five days, the current divergence looks more like June and could extend to the 50-day SMA around 151.
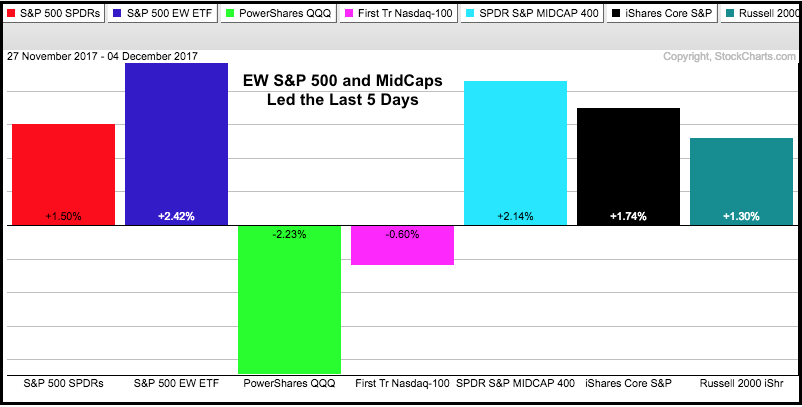
Mid-caps Shine on PerfChart
Chartists can compare recent performance by using a PerfChart to measure the percentage change over the last five days. QQQ fell 2.23% during this period, while SPY advanced 1.5% and IWM advanced 1.3%. Two groups stand out on this chart. The EW S&P 500 ETF (RSP) is leading with a 2.42% gain and the S&P MidCap SPDR (MDY) is second with a 2.14% gain. Believe it or not, there are plenty of midcaps in the EW S&P 500 ETF and this suggests that mid-caps are the current sweet spot.
Candlesticks versus Closing Prices
Candlesticks show some wild intraday swings over the last two days, but closing prices show relatively tame price action over the last four days. The Russell 2000 iShares (IWM) dipped sharply on Friday and then recovered to close near the high of the day and form a hanging man candlestick, which is a bearish reversal that requires confirmation with further downside. IWM then opened strong on Monday and closed near the low of the day to form a long filled candlestick. Taking the two days together, we basically have a "push" because Friday's intraday recovery was offset by Monday's post-open selling pressure. Personally, I pretty much ignore bearish candles when the bigger trend is up. This candles may foreshadow a correction, but I do not think they are actionable because I do not take bearish setups in an uptrend.
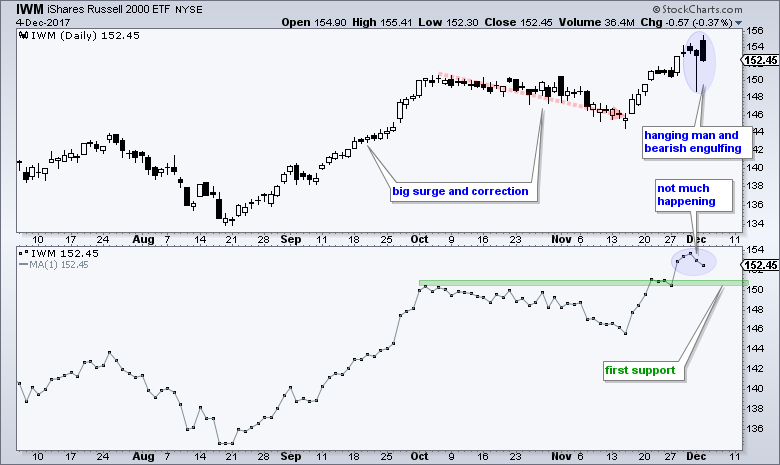
The bottom window shows a close-only chart to filter out some of the noise. Despite some intraday volatility, IWM has not moved much since first exceeding 152 on November 28th. Overall, the trend is up with the recent break above the October high and a fresh 52-week high on November 21st. Broken resistance and the three-day stall in late November mark first support in the 150-151 area (green zone). A pullback to this area could set up a short-term mean-reversion opportunity.
Bonds and Dollar Push-Pull Gold
Before looking at some stock setups, I would like to cover the 20+ YR T-Bond ETF (TLT), the Gold SPDR (GLD) and the US Dollar ETF (UUP). First, note that GLD and TLT are positively correlated and tend to rise/fall together. Thus, the November rise in TLT was positive for gold over the six weeks. Second, GLD and UUP are negatively correlated and tend to move in opposite directions. Thus, the decline in UUP over the last five weeks was also positive for gold. One would expect gold to be higher when TLT is higher and the Dollar is lower. But it is now. Gold has gone nowhere despite these positive influences. Perhaps something else is taking gold's place as an alternative asset.
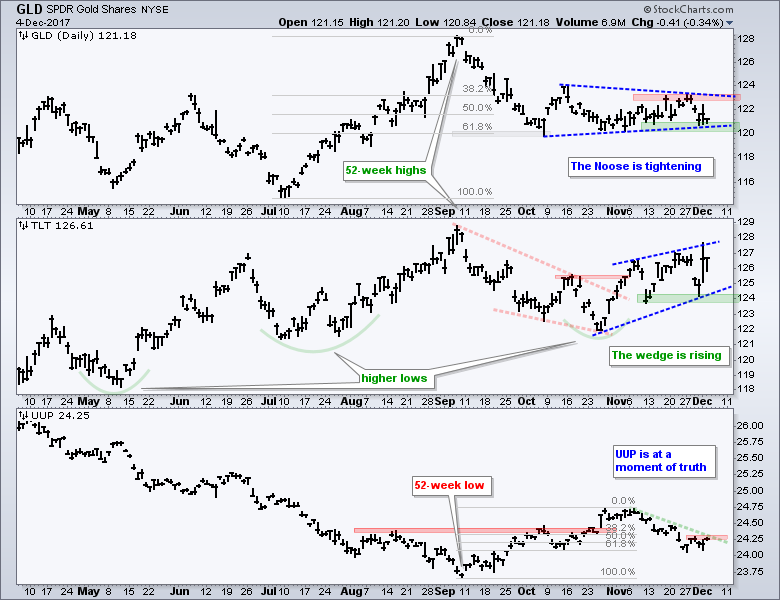
The middle window shows TLT within a long-term uptrend and short-term uptrend. The bigger trend is up because of the 52-week high in early September and a higher low in late October. The rising wedge since late October defines the short-term uptrend with the November lows marking support. The lower window shows UUP at a moment-of-truth because the November decline retraced 61.8% of the prior advance. UUP firmed the last six days and a breakout at 24.3 would be short-term bullish.
IDXX Breaks Flag Resistance
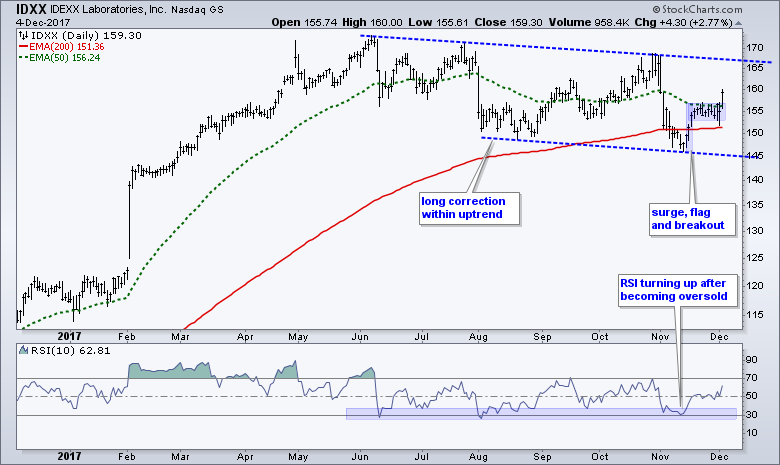
IDEXX Laboratories (IDXX) hit a 52-week high way back in May and then corrected with a falling channel into November. The six month trend is still down, but the stock is showing signs of life with a surge back above the 200-day EMA and a flag breakout. The channel trend line and early November high mark the next challenge.
EBAY Bids to End Correction
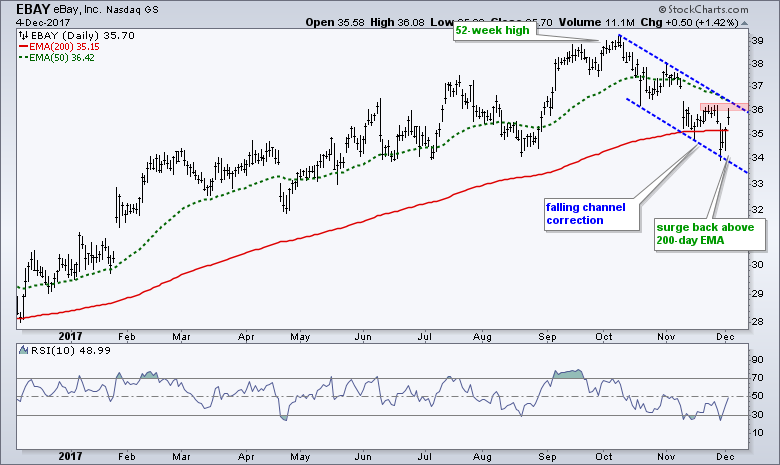
Ebay (EBAY) shows signs of ending its correction with a surge back above the 200-day EMA. The stock hit a 52-week high in October and then corrected with a falling channel into late November. This looks like a correction within a bigger uptrend and the two-day surge provides the first sign that this correction is ending. Look for a follow through break above the late November high to fully reverse the correction.
Ball Corp Surges off Support Zone
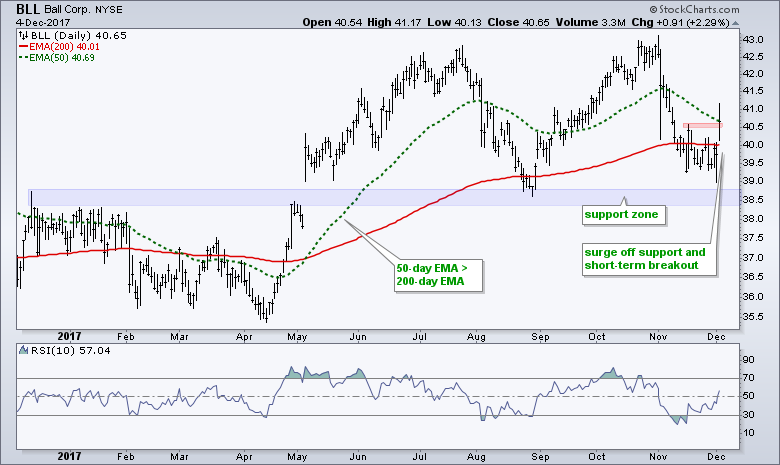
Ball Corp (BLL) fell sharply in the first part of November, but managed to firm above the August lows and support zone. This firmness turned to buying pressure as the stock gapped up and closed above the mid November high. Also notice that the 50-day EMA is above the 200-day EMA and RSI is turning up from oversold levels.
******************************************************
ETF Master ChartPack - 300+ ETFs organized in a Master ChartList and in individual groups.
Follow me on Twitter @arthurhill - Keep up with my 140 character commentaries.
****************************************
Thanks for tuning in and have a good day!
--Arthur Hill CMT
Plan your Trade and Trade your Plan
*****************************************


