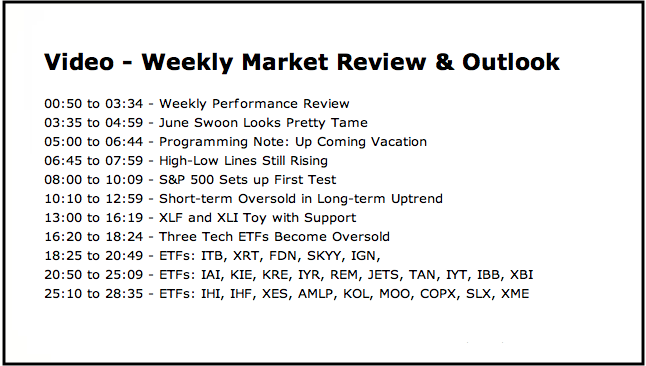
- June Swoon Looks Pretty Tame.
- Programming Note: Up Coming Vacation.
- High-Low Lines Still Rising.
- S&P 500 Sets up First Test.
- Short-term Oversold in Long-term Uptrend.
- XLF and XLI Toy with Support.
- Three Tech ETFs Become Oversold.
- Notes from the Art's Charts ChartList.
 ...There are plenty of reasons to be negative on stocks right now, but the weight of the evidence still favors the bulls. On the negative side, we have bearish seasonal patterns at work, strength in safe-haven bonds, downtrends in XLF and XLI, and relative weakness in the S&P 500 (relative to small-caps).
On the positive side, the 50-day EMA is still above the 200-day EMA for the S&P 500 and this key benchmark is still in a long-term uptrend. Furthermore, the Small-Cap SPDR (IJR), Nasdaq 100 SPDR (QQQ), the Retail SPDR (XRT) and the Regional Bank SPDR hit new highs earlier this month, as did a host of tech-related ETFs.
As always, we must take an objective look and apply a weight of the evidence approach when it comes to broad market analysis. Stocks were hit in June, but these hits are not any worse than the pullbacks seen earlier this year.
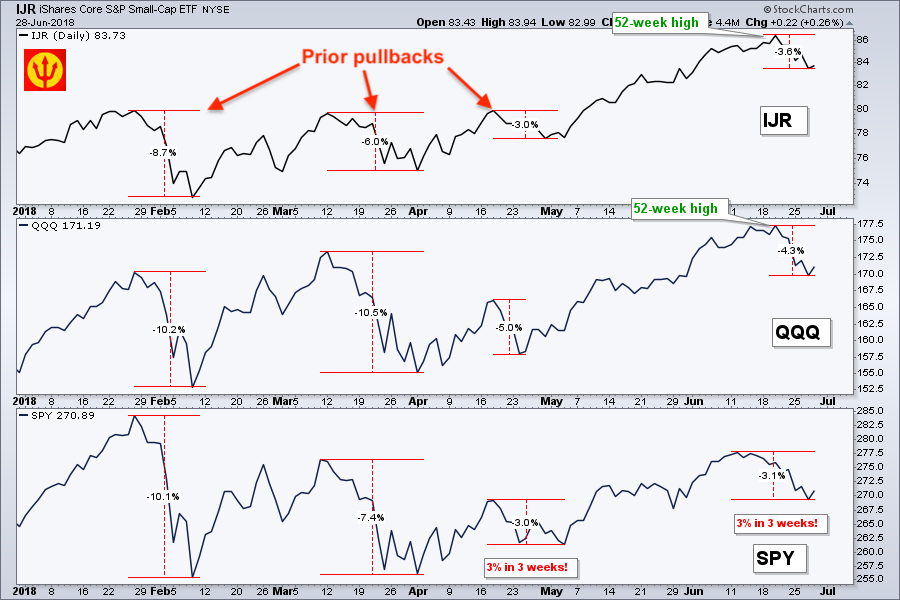
From the June high to this week's low, IJR fell 3.6%, QQQ fell 4.3% and SPY fell 3.1%. These declines are comparable to the April declines and much less than the declines in March. After hitting 52-week highs, IJR and QQQ are entitled to pullbacks and I will treat these as pullbacks within uptrends until the long-term evidence changes.
Just to make it easy, the final straw is when the 50-day EMA crosses below the 200-day EMA for the S&P 500. Right here, right now, the shorter moving average is well above the longer moving average.
Programming Note: Up Coming Vacation
It is family vacation time and I will be off the first two weeks of July. The next commentary will then be on Monday, July 16th. Happy 4th of July!
High-Low Lines Still Rising
The next chart shows the High-Low Lines for the S&P 1500, S&P 500, S&P Mid-Cap 400 and S&P 500. The High-Low Line is a cumulative measure of net new highs. The market has a bullish bias as long as these lines rise and are above their 10-day EMAs. All four are above their 10-day EMAs. The S&P Small-Cap 600 High-Low Line crossed above the 10-day EMA in early March, S&P Mid-Cap 400 followed in early April and the S&P 500 crossed in early May.
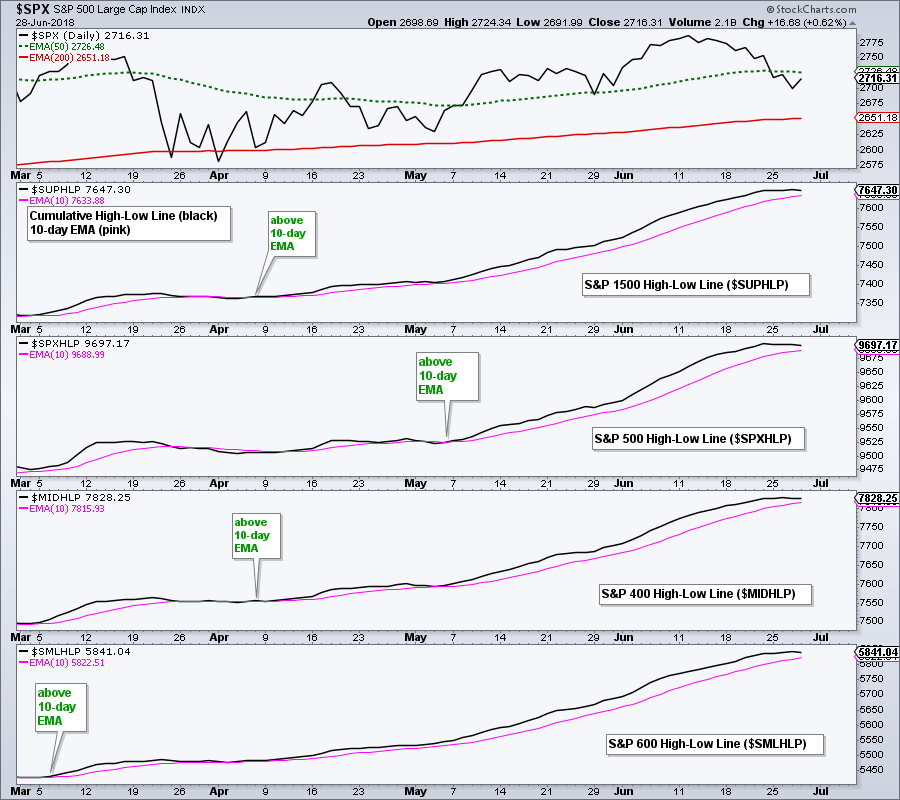
A four month chart and 10-day EMA may seem short-term, but this is really a medium-term indicator. High-Low Lines move pretty slow so a short moving average is all that is needed. I would not become concerned with the current pullback until three of these four lines cross below their 10-day EMAs.
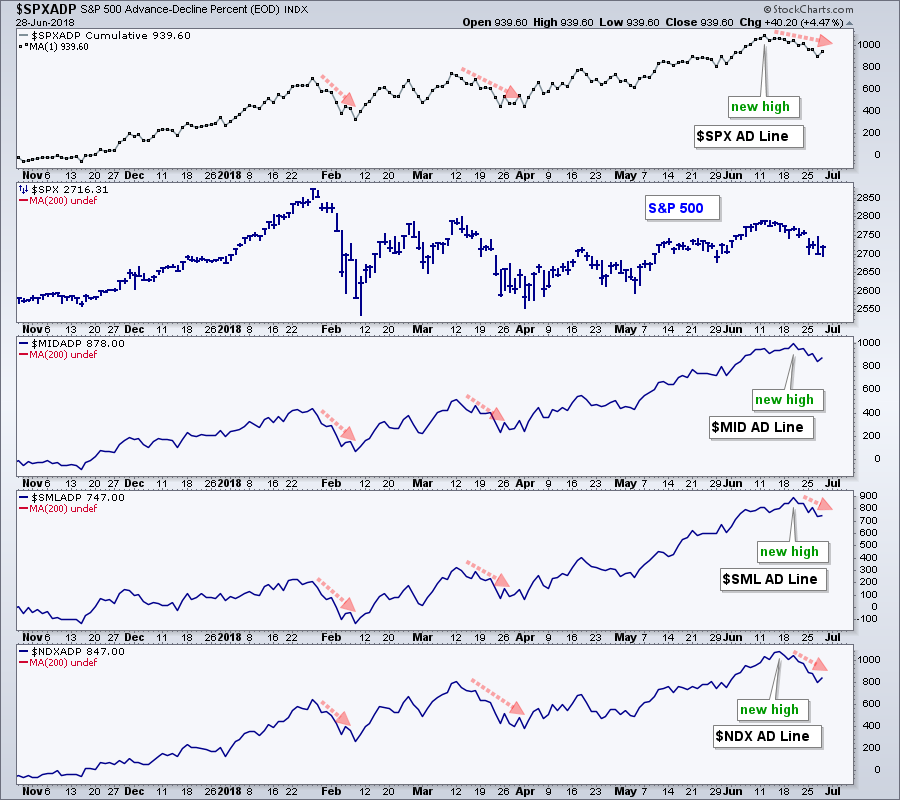
AD Lines Pull Back after New Highs
The AD Lines for the major stock indexes hit new highs in June and pulled back the last few weeks. The new highs are bullish and suggest that the long-term trend is up (for breadth at least). A pullback after a new high is pretty normal at this stage. The red arrow-lines show prior pullbacks in February and March.
S&P 500 Sets up First Test
The S&P 500 moved sharply lower on Monday and then chopped around the next three days. Despite a gap down on Monday and 3% decline in two weeks, the big picture remains unchanged. The index broke out of a big triangle in May and the breakout zone turns first support in the 2675-2725 area. With recent weakness, the index is testing this breakout zone. A close below 2675 is the first level to watch for a breakout failure. Long-term, the lows from late April and early May mark key support in the 2600-2625 area.
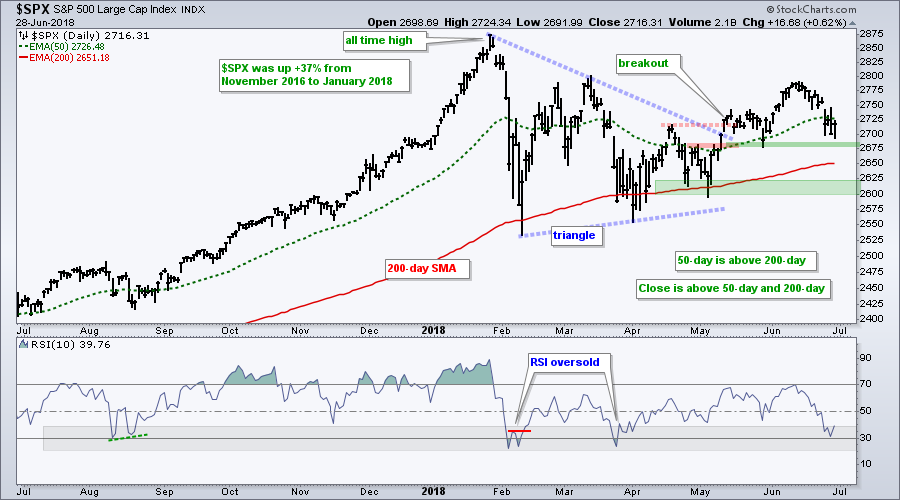
The indicator window shows 10-day RSI almost dipping below 30 this week. Overall, RSI shows just how difficult 2018 has been for the S&P 500. Note that the indicator dipped below 30 just once in 2017 and exceeded 70 at least ten times. Moves above 70 show strong momentum and usually occur in uptrends. In contrast, RSI dipped below 30 three times already in 2018 and exceeded 70 just once.
Short-term Oversold in Long-term Uptrend
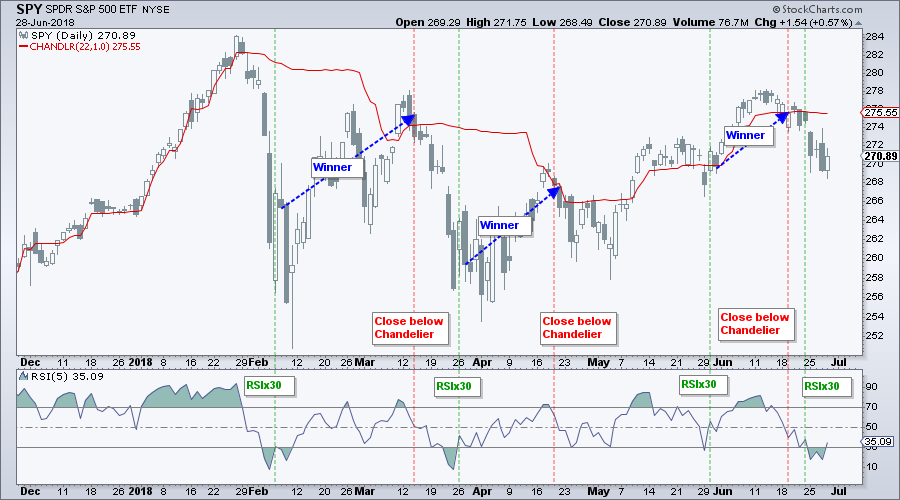
It's time to play "Would you have the Nerve" because 5-day RSI became oversold for SPY, QQQ, MDY and IJR. These are my big four in my mean-reversion system, which is explained in detail in this System Trader article (click here). Here are the buy conditions:
- Bull Market: 50-day EMA is above 200-day EMA for S&P 500.
- Entry: RSI(5) crosses above 30 for the ETF
- Exit: Price closes below Chandelier Exit (22,1).
- Note: Price is usually below the Chandelier Exit at Entry.
This system only trades in a bull market. Note that I changed from a 5-day EMA to a 50-day EMA because this reduced the drawdowns. The ETF becomes oversold when RSI moves below 30 and a buy signal triggers on a move back above 30. The buy signal usually triggers when price is below the Chandelier Exit. Thus, a sell setup is not possible until prices move above the Chandelier Exit. Make sure you study and understand how the indicators work.
XLF and XLI Toy with Support
I am a bit jaded with the notion of support and resistance levels for ETFs and indexes that have dozens, if not hundreds, of moving parts. These moving parts are also known as stocks. The S&P 500 has 500 of them, the Financials SPDR (XLF) has over 60 stocks and the Russell 2000 has some 2000 stocks. Each stock has its own support and resistance levels, and these levels do not always jibe with the index or ETF. Thus, take the following support and resistance levels with a grain of salt.
The first chart shows the Financials SPDR (XLF) with RSI(10) for overbought/oversold readings and the Percentage Price Oscillator (25,125,0) for trend assessment. The PPO is positive when the 25-day EMA is above the 125-day EMA and negative when the 25-day EMA is below the 125-day EMA. It is not perfect, but pretty good as defining 3-6 month trends.
Price-wise, XLF peaked in late January and declined the last five months, hitting a six month low this week. The PPO dipped into negative territory for the second time in two months. Thus, the trend is clearly down here.
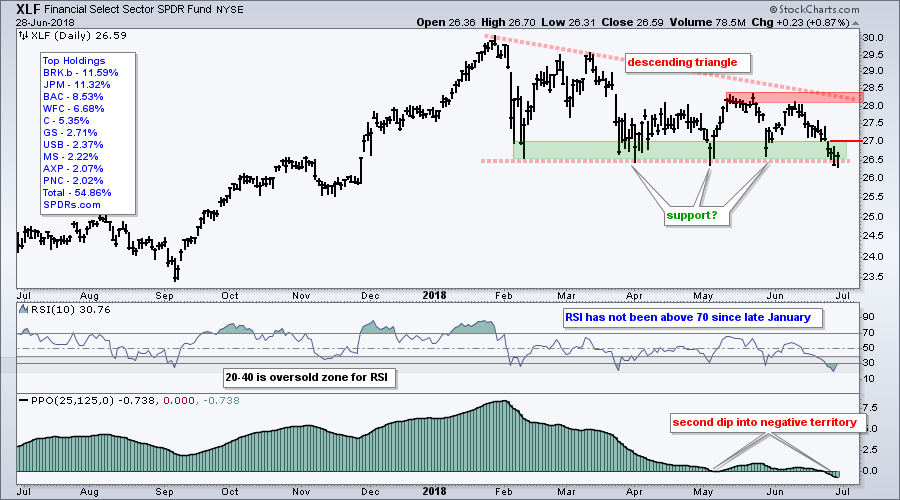
The February to May lows mark a possible support zone in the 26.5 area and the ETF is trying to hold this area. Look for a close above 27 as the first sign of a successful test. A break above 28.5 is needed to reverse the 2018 downtrend.
The next chart shows XLI with similar characteristics as it battles support in the 71 area. Look for a break above 73 for the first sign of a successful test. A break above the May-June highs is needed to reverse the 2018 downtrend.
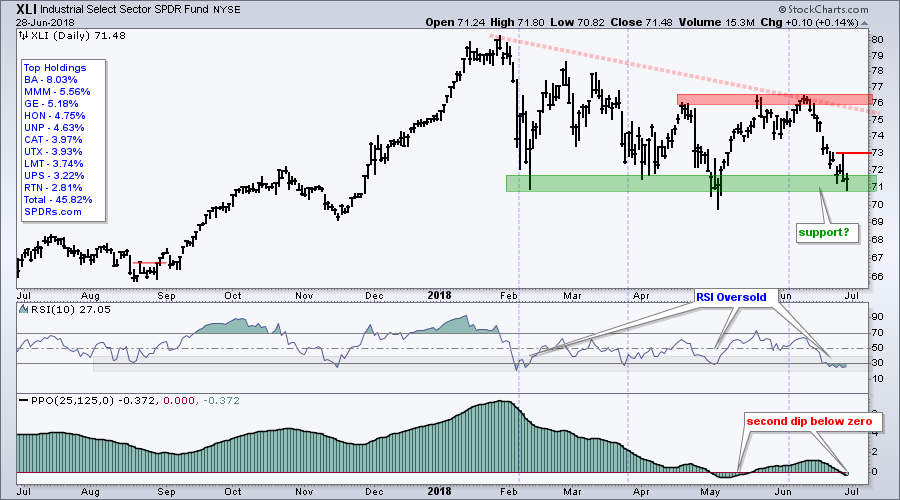
I think XLI and XLF hold the key to the S&P 500 right now. Both are holding the market back and the main reason the S&P 500 has been flat this year. Breakouts in these two laggards would be a big plus for the market. Until such breakouts, the S&P 500 is likely to meander and frustrate.
Three Tech ETFs Become Oversold
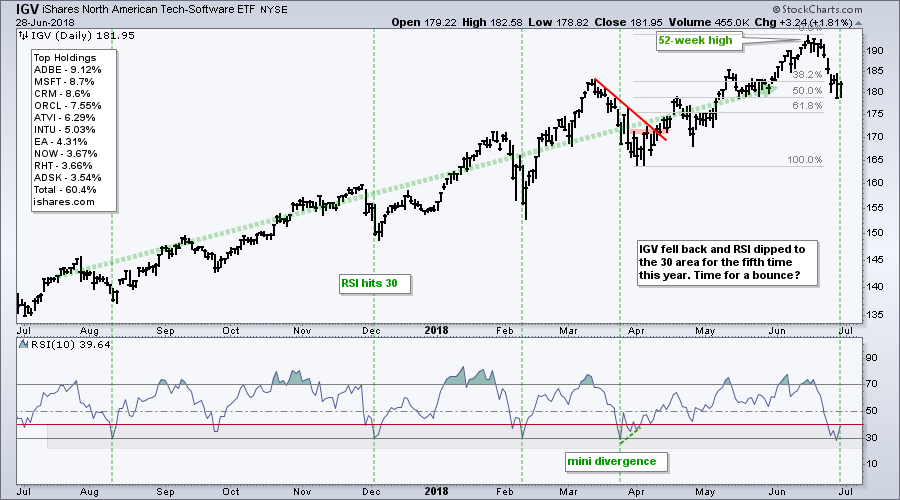
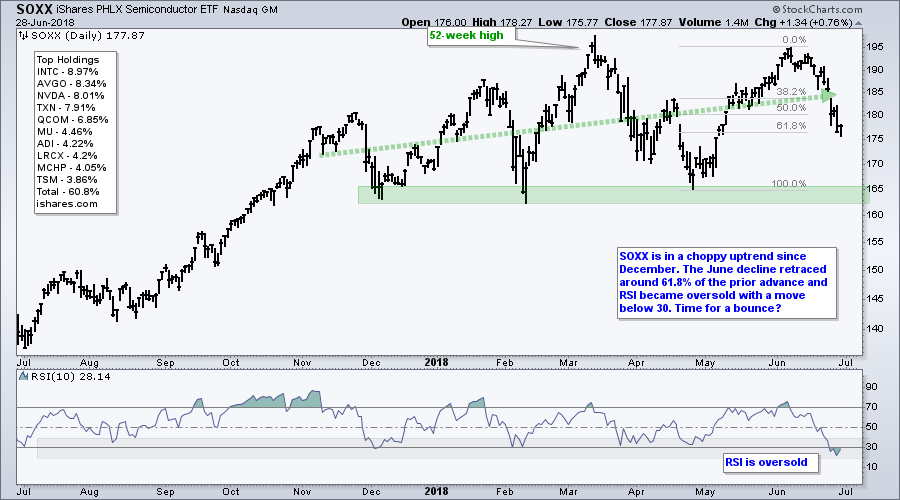
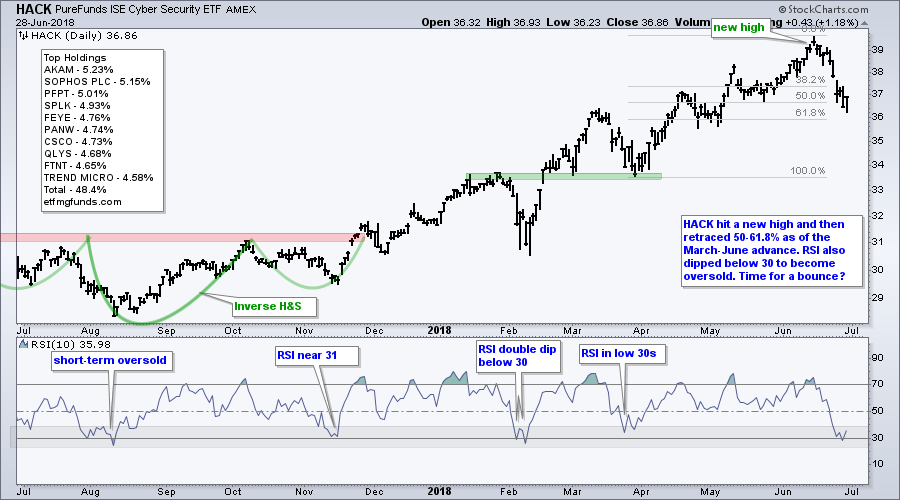
In contrast to XLI and XLF, the tech sector is till performing well and three related ETFs have mean-reversion setups working. RSI(10) dipped below 30 for the Cyber Security ETF (HACK), the Software iShares (IGV) and the Semiconductor iShares (SOXX) this week. All three are in uptrends because they recorded 52-week highs in June.
A dip below 30 in RSI indicates a pullback and a short-term mean-reversion opportunity. RSI is oversold after the pullback and a reversion back towards the mean is expected at some point. Timing, of course, is everything. You might consider analyzing the 2-3 week downtrend on an intraday chart and looking for an early breakout point.
Note on RSI Settings: I typically use RSI(5) for the broad index ETFs and RSI(10) for stocks and other ETFs. The line shapes look pretty much the same, but the high-low range is often different. RSI(5) has a wider high-low range than RSI(10) and this means it will cross 70/30 more often. One is not better than the other, it is just a person preference. Study both and see what works best for you.
Notes from the Art's Charts ChartList (30 ETFs)
- The Broker-Dealer iShares (IAI) is at its moment-of-truth as the ETF fell to its support zone and RSI became oversold.
- The Regional Bank SPDR (KRE) is in a long-term uptrend and RSI is below 30. This means it is oversold and a mean-reversion opportunity may be at hand.
- The iShares Aerospace & Defense ETF (ITA) remains range bounce and RSI is bouncing from oversold levels.
- The Biotech iShares (IBB) and Biotech SPDR (XBI) fell hard the last six days, but both are near support at 50% retracements.
- The Oil & Gas Equip & Services SPDR (XES) is trying to bounce off a key retracement and break short-term resistance.
- Click here for the Art's Charts ChartList (30 ETFs)
Questions, Comments or Feedback?
I cannot promise to response to all correspondence, but I will read it and take into under consideration. I greatly appreciate all feedback because it helps me improve the commentary and provides ideas for the future. Sorry, I do not take symbol requests.

Plan Your Trade and Trade Your Plan.
- Arthur Hill, CMT
Senior Technical Analyst, StockCharts.com
Book: Define the Trend and Trade the Trend
Twitter: Follow @ArthurHill


