- Small-caps Stall as Large-cap Techs Lead
- More Strength than Weakness
- S&P 500 Notches a New High
- Seasonal Patterns are Mixed
- The Ebb and Flow of QQQ
- Big Flows in SKYY, HACK and IGV
- Big Three are Up Big (XLK, XLY, XLV)
- Notes from the Art's Charts ChartList
 Small-caps Stall as Large-cap Techs Lead
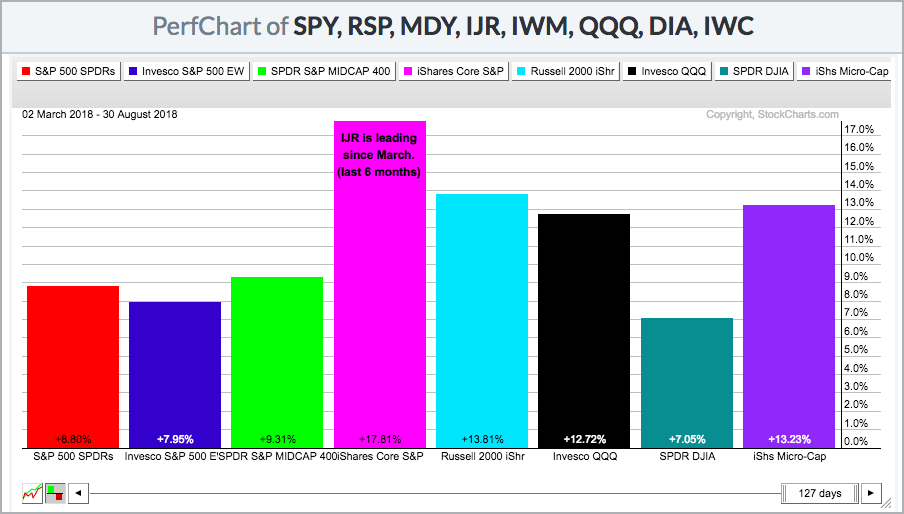
It is shaping up to be another big week for stocks, but not all stocks. QQQ led the charge with a 2% gain the last four days and move to new highs. SPY was also strong with a 1% gain, but the S&P SmallCap iShares (IJR) finished flat with a .02% gain. Once again, we see large-cap techs leading the charge. I am not going to read too much in to small-cap underperformance because it is just one week and IJR is still leading over the last six months.
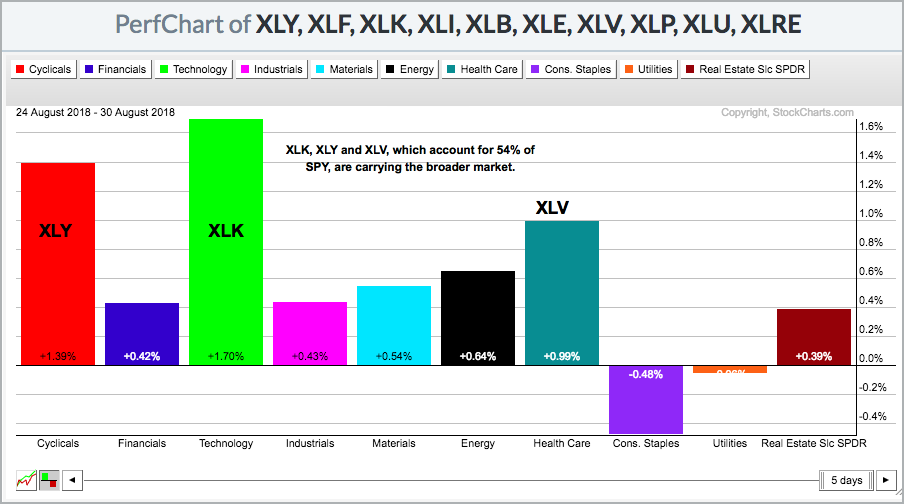
As far as the sectors are concerned, the market returned to its old ways with the Consumer Discretionary SPDR (XLY) and Technology SPDR (XLK) leading the way. The Financials SPDR (XLF) and the Industrials SPDR (XLI) were up this week, but lagged SPY. XLF remains one of the weaker sectors overall, but this is not a problem for the broader market as long as XLK, XLY and XLV are strong. The latter three account for 54% of SPY.
More Strength than Weakness
Keep in mind that the majority rules when it comes to broad market analysis. In other words, we do not need 80% upside participation for the market to move higher. 50 plus 1 percent is enough to keep the market afloat and anything above this is enough to push an index higher. There are clearly pockets of weakness, but there are more pockets of strength than weakness right now.
Year-to-date, some 996 stocks in the S&P 1500 are positive and show gains. This is two thirds of the market and plenty to power an uptrend. The S&P 1500 includes the S&P 500, S&P Mid-Cap 400 and S&P Small-Cap 600. Of these 1500 stocks, 663 are up more than 10% and 263 are down more than 10% year-to-date. Again, the balance favors strength over weakness.
We have heard a lot about lagging new highs over the last few months. The indexes are at new highs, but fewer stocks are hitting new highs. New highs peaked for the S&P 500 and S&P Mid-Cap 400 in January, while new highs peaked in June for the S&P Small-Cap 600. Note, however, that new highs in the S&P 500 have been quietly expanding since June (thanks to healthcare and retail).
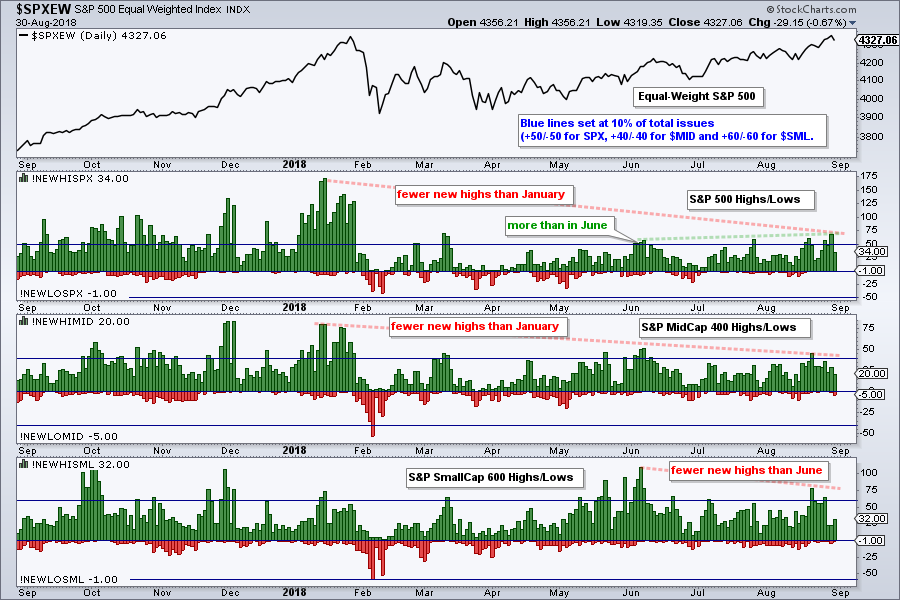
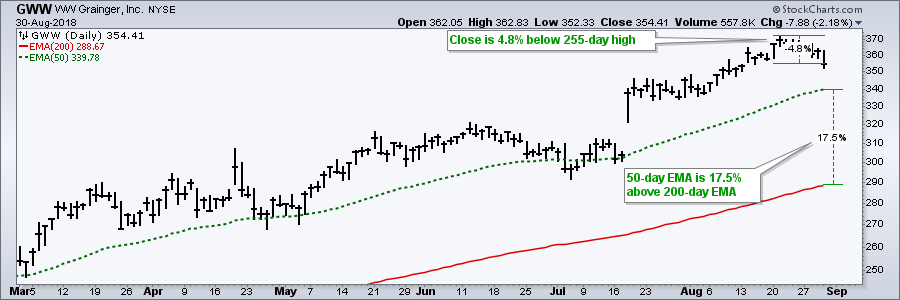
Even though new highs are not as strong as before, consider that 518 stocks in the S&P 1500 are within 5% of a 255-day high, which is a 52-week high. This means one third of stocks in the S&P 1500 are quite close to their 52-week highs. A stock this close to a new high is surely in a long-term uptrend.
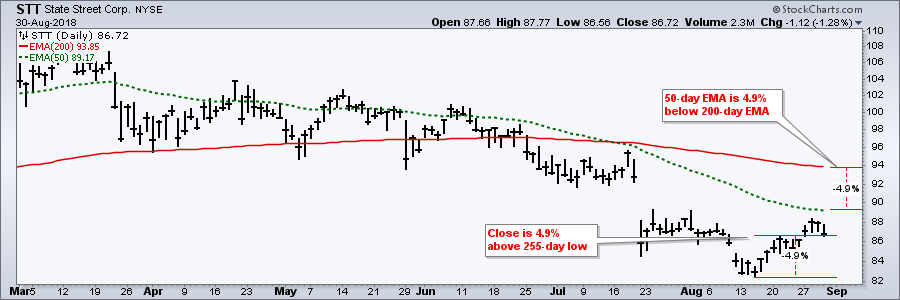
Furthermore, just 59 stock are within 5% of a new low. Once again, the weight of the evidence remains bullish.
S&P 500 Notches a New High
There is nothing new to report on the S&P 500 chart, which I think is the single most important price chart in the stock market. Think about it. If you had to pick one chart to distinguish between bull and bear markets, what would it be? My choice is the S&P 500. Yes, it is weighted towards large-caps. Yes, it is heavy on the technology side. Yes, it only represents 500 stocks, at best.
Despite these "drawbacks", the S&P 500 is still the most widely followed benchmark and the golden cross remains as good a barometer as any for long-term trend identification. I still consider it the single most important chart in my arsenal.
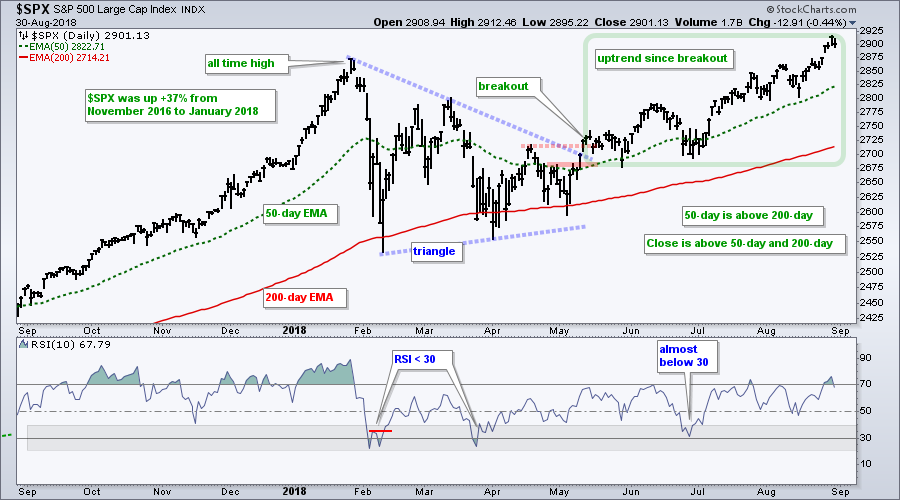
The triangle breakout in May was the last big signal on this chart. This breakout ended a three month consolidation and signaled a resumption of the bigger uptrend. I have pretty much been in monitoring mode since this signal. Also note that the 50-day EMA is above the 200-day EMA and price is above the rising 200-day EMA.
September Seasonal Patterns are Mixed
The bulk of the evidence is clearly bullish for stocks, but September and October are around the corner. I do not use seasonal patterns very much because I prefer to take my cues from price action. However, it is hard not to be wary of September and October, especially when stocks are up sharply and ripe for a correction of some sorts. Let’s see what the evidence suggests.
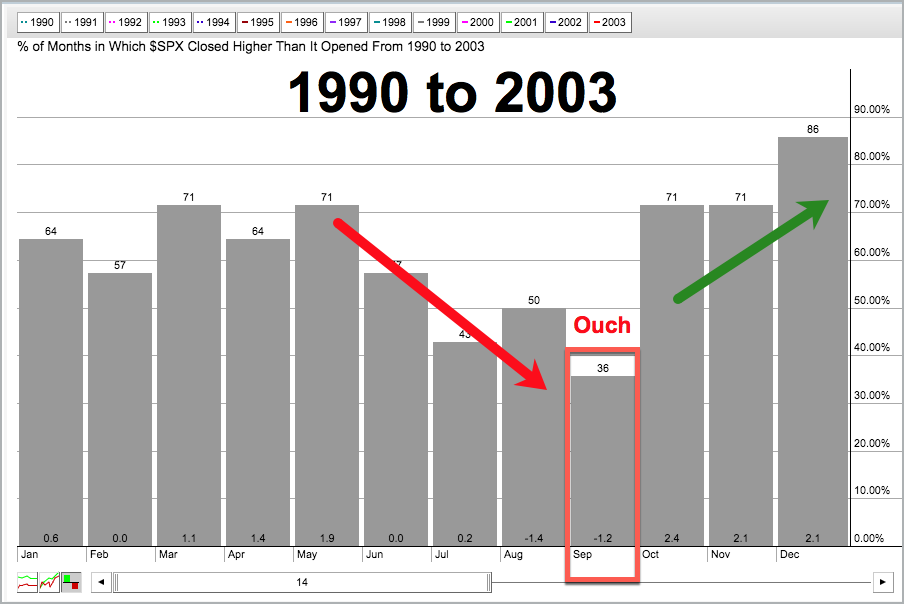
I am going to divide the seasonality chart into two periods covering 29 years. The first runs from 1990 to 2003 (14 years) and the second runs from 2004 until August 2018 (15 years). The first period shows September as the worst month by far. The S&P 500 closed higher just 36% of the time and the average gain/loss was a loss of 1.2%. September seasonality was clearly negative during this 14 year stretch.
The second period paints a different picture. Over the last 15 years, the S&P 500 closed higher 64% of the time in September and the average gain was .5%. Thus, September has not been that bad the last 15 years.
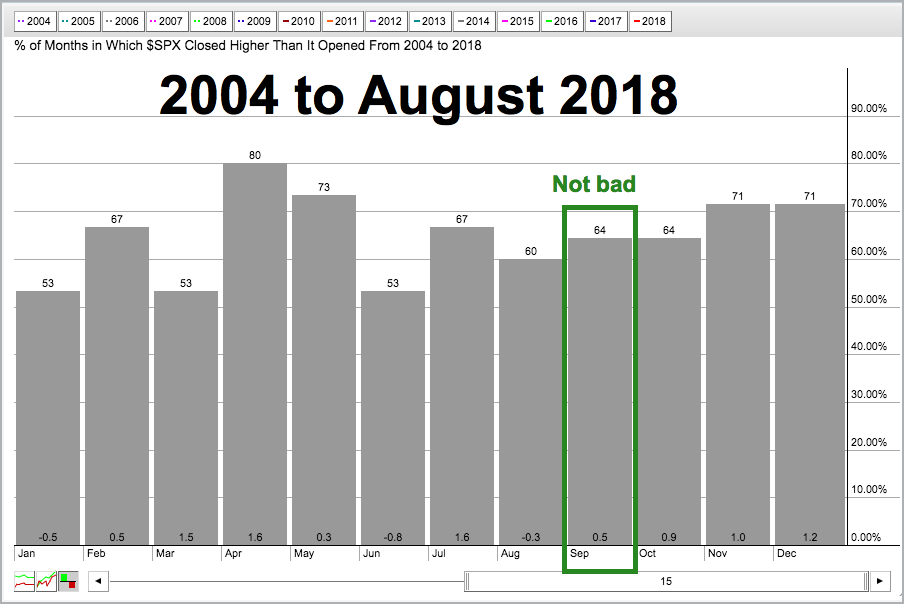
Ov, the long-term evidence is split when it comes to September. There was a clear negative bias during the first 14 year period, but a positive bias over the last 15 years. I would, therefore, keep seasonal patterns on the back burner and price action on the front burner.
The Ebb and Flow of QQQ
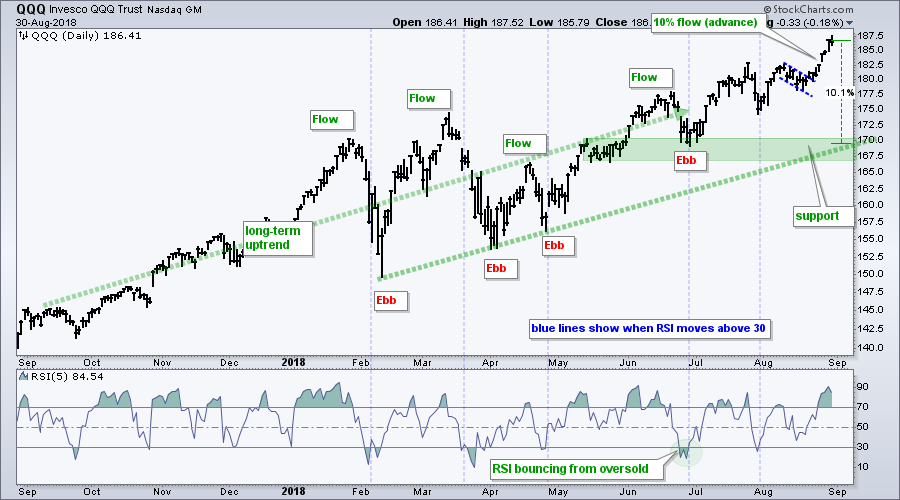
Ebb and flow are terms used to describe tidal movements. Ebb is when the tide subsides and flow is when the tide rises. In price chart terms, we could consider ebb as a price decline and flow as a price advance. A zigzag uptrend would reflect this ebb and flow. With SPY and QQQ surging to new highs this week, we are clearly in the flow part of this phase.
The next chart shows QQQ with a 10% surge to new highs. QQQ is quite extended during this "flow" and this means we could see some ebbing in the coming weeks, perhaps after Labor Day. Personally, I find it much harder to predict pullbacks in an uptrend than oversold bounces. In addition, I am only interested in oversold conditions in an uptrend, not overbought conditions. Nevertheless, it might be prudent to consider taking some money off the table or tightening stops.
Big Flows in SKYY, HACK and IGV
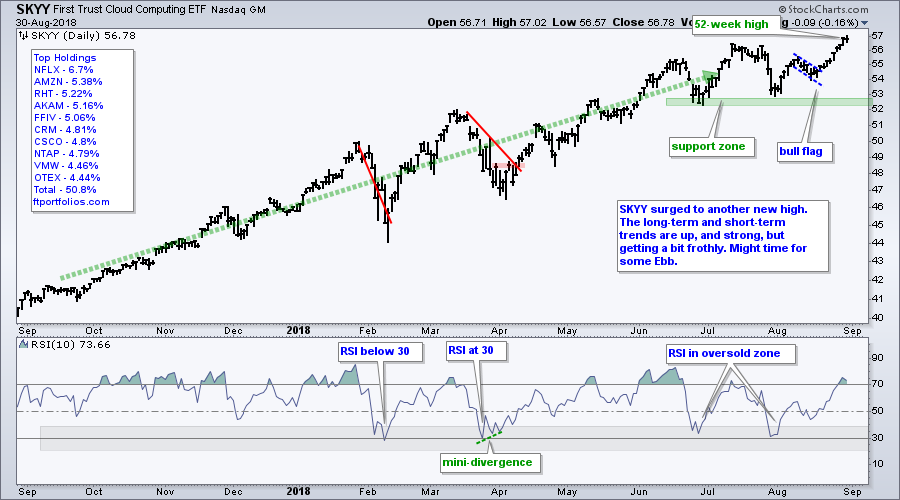
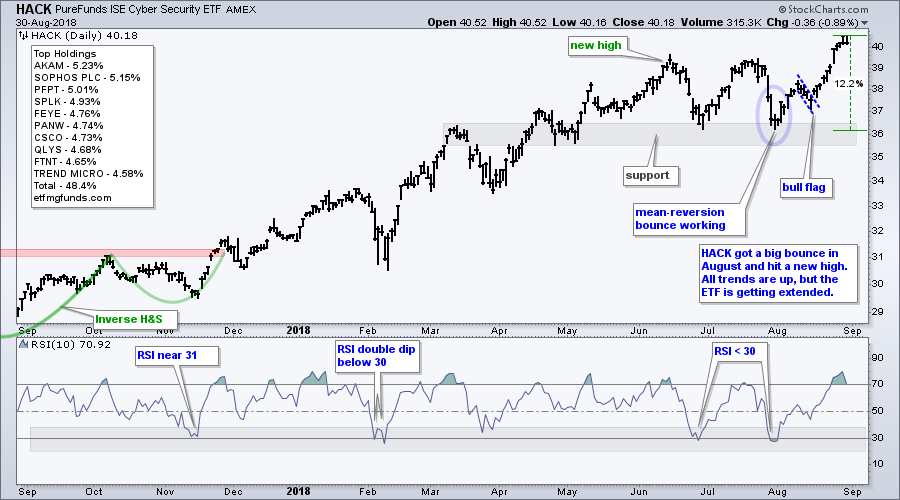
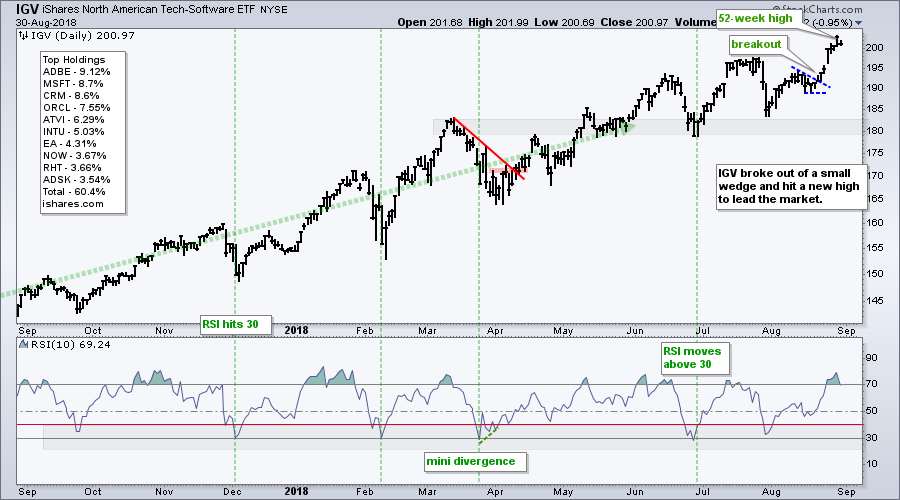
The Cloud Computing ETF (SKYY), Cyber Security ETF (HACK) and Software iShares (IGV) led the tech sector with double digit moves to new highs. These are clearly big flows (advances) and these flows could lead to some ebbing (pullback).
HACK is up over 10% since becoming short-term oversold in late July. The new high is clearly bullish long-term, but notice how trading has been choppy since June. This means HACK could be due for a little ebb now.
IGV sports a consistent uptrend over the past year with a zigzag higher (flow and ebb). The move to new highs is bullish and affirms the existing uptrend, but we may soon see some ebb.
Big Three are Up Big
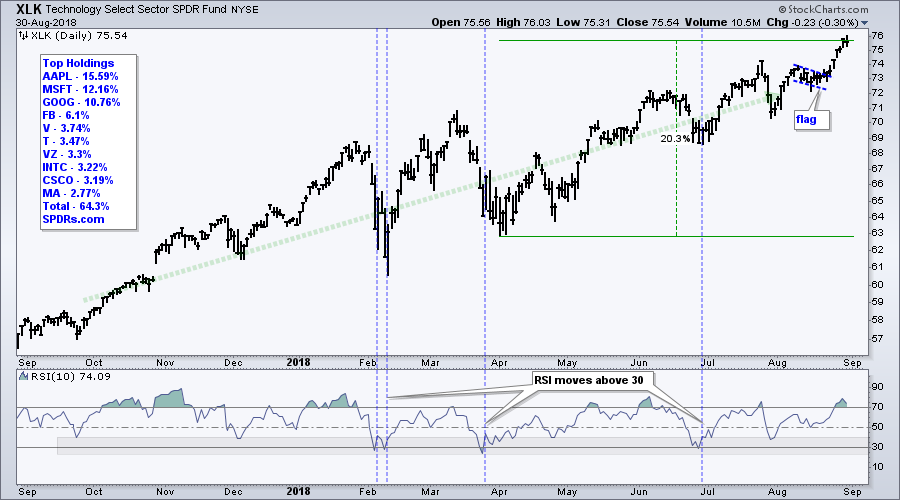
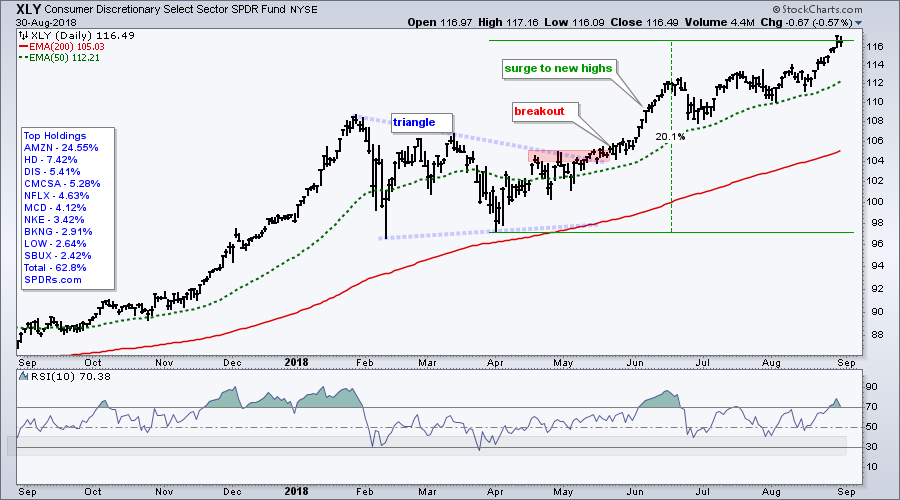
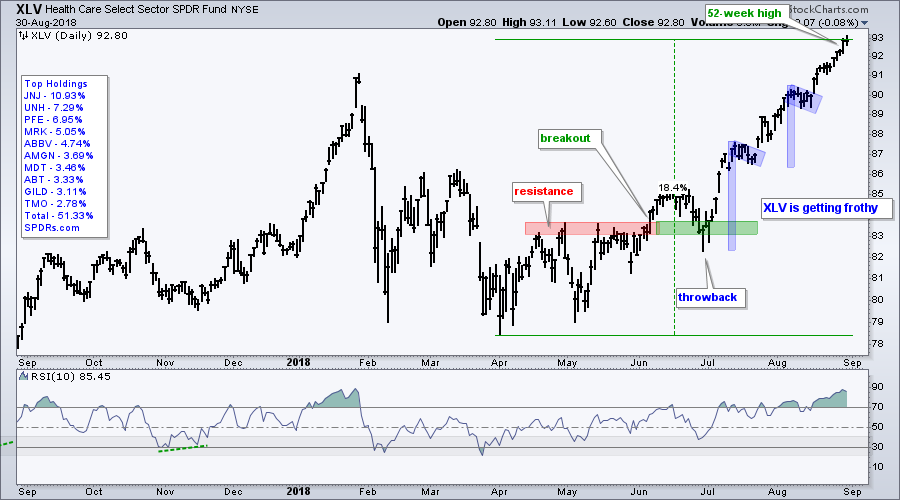
Speaking of big flows, the Technology SPDR (XLK), Consumer Discretionary SPDR (XLY) and Health Care SPDR (XLV) are up between 18 and 20 percent from their spring lows. I do not see any topping patterns on these charts and overextended advances can extend longer than expected. Nevertheless, these are big gains over the last four to five months. Strategically (long-term), I am still bullish. Tactically (shorter-term), I would be a little more leery.
Notes from the Art's Charts ChartList
- The Home Construction iShares (ITB) bounced last week, but fell back this week and is already filling the gap up. ITB remains one of the weakest ETFs in 2018.
- The Semiconductor SPDR (XSD) hit a new high and shows leadership, but the Semiconductor iShares (SOXX) has yet to exceed its June high (blame INTC).
- The Biotech iShares (IBB) and Biotech SPDR (XBI) led the market the last two weeks. IBB broke out of a triangle and XBI surged off support.
- The Broker-Dealer iShares (IAI) broke short-term resistance, but is not "On Trend" because of the lower highs since March.
- The Regional Bank SPDR (KRE) fell back this week and did not even challenge its June high. Still shows relative weakness.
- The Transport iShares (IYT) hit a new high in August, but the Dow Diamonds (DIA) did not (for Dow Theory fans, and bears).
- The Oil & Gas Equip & Services SPDR (XES) is not "On Trend" and remains one of the weakest industry group ETFs.
- The Coal ETF (KOL) has a bearish head-and-shoulders forming.
- The Metals & Mining SPDR (XME) bounced over the last two weeks, but this could be just a dead cat bounce. Ditto for the Steel ETF (SLX).
- Click here for the Art's Charts ChartList
Questions, Comments or Feedback?
I cannot promise to response to all correspondence, but I will read it and take into under consideration. I greatly appreciate all feedback because it helps me improve the commentary and provides ideas for the future. Sorry, I do not take symbol requests.

Plan Your Trade and Trade Your Plan.
- Arthur Hill, CMT
Senior Technical Analyst, StockCharts.com
Book: Define the Trend and Trade the Trend
Twitter: Follow @ArthurHill


