- S&P 500 Reaches 2018 Highs.
- Watch the Immediate Uptrend.
- IWM Holds Flag Breakout.
- Small-caps Breadth Indicators Net Bearish.
- %Above 200-day EMA Hits Milestone for XLF.
- Utilities Correct within Bigger Uptrend.
- Stock Performance During Earnings Season.
- ChartList Updates.
- About the Art's Charts ChartList.
 ... S&P 500 Reaches 2018 Highs
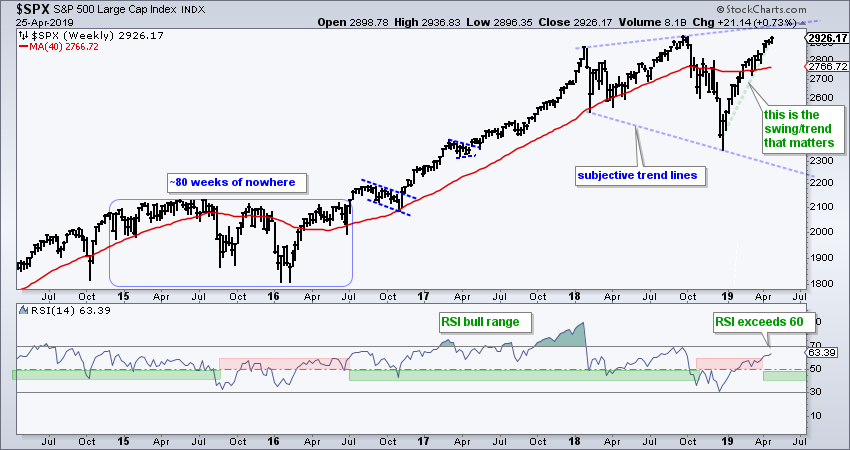
We will start with a weekly chart of the S&P 500 as it challenges the 2018 high. Should the index move above this high, pundits will likely start talking about a broadening formation or pattern, which is an extremely rare bearish reversal pattern that will be a field day for the bears. The blue lines, which are subjective trend lines, mark this possibility and the upper line extends to the 2970-3000 area. Thus, this is the first area for top pickers to watch. The video will be added by 11AM ET.
In their classic book, Technical Analysis of Stock Trends, Edwards & Magee discuss the broadening formation for several pages. Here is one paragraph:
"If the Symmetrical Triangle presents a picture of “doubt” awaiting clarification, and the Rectangle a picture of controlled “conflict,” the Broadening Formation may be said to suggest a market lacking intelligent sponsorship and out of control — a situation, usually, in which the “public” is excitedly committed and which is being whipped around by wild rumors. Note that we say only that it suggests such a market. There are times when it is obvious that those are precisely the conditions which create a Broadening Pattern in prices, and there are other times when the reasons for it are obscure or undiscoverable. Nevertheless, the very fact that chart pictures of this type make their appearance, as a rule, only at the end or in the final phases of a long Bull Market lends credence to our characterization of them"
According to Edwards & Magee, a broadening formation at this stage could mark the end of the bull market that began in 2009. Those looking for a bearish narative can look for a reveral at the upper trendline (3000) and then a bust. The end of the bull market, however, does not necessarily entail a bear market. It is entirely possible that a big symmetrical triangle (narrowing range) forms on the right side of the broadening formation and this would be frustrating for both bulls and bears.
Watch the Immediate Uptrend
As ominous as the broadening formation sounds, it is not my concern right now. As far as I am concerned, the current upswing or uptrend from late December to April is the dominant trend to watch. The fact that the index is near an all time high and well above the rising 200-day SMA tells me the big trend is up. In addition, RSI is in a bull range and the breadth indicators are net bullish. The broadening formation is subjective and potential at this stage. The current uptrend is real and right now. Furthermore, I will not turn bearish until there is bearish evidence, which means I will likely miss the top. As usual, I will watch the 20 and 200 day SMAs, the RSI range and the breadth indicators for clues on the current uptrend.
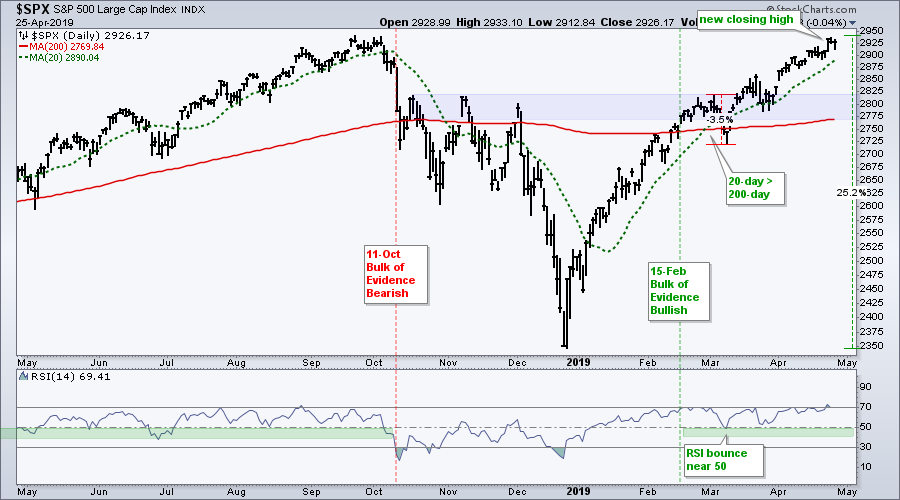
The index is up around 25% from the late December low and the biggest pullback from high to low was just 3.5% during this advance. How crazy is that?! The index was overbought in mid January, mid February, late February, mid March, mid April and now late April. You get the idea. Timing a pullback in a strong uptrend is a difficult task. Nevertheless, the index is quite extended and a correction would be perfectly normal. The blue zone marks a potential support area to watch should we get a "garden variety" correction. A 5-6% pullback from current levels would retrace just a quarter of the current advance and return to the 200-day SMA.
IWM Holds Flag Breakout
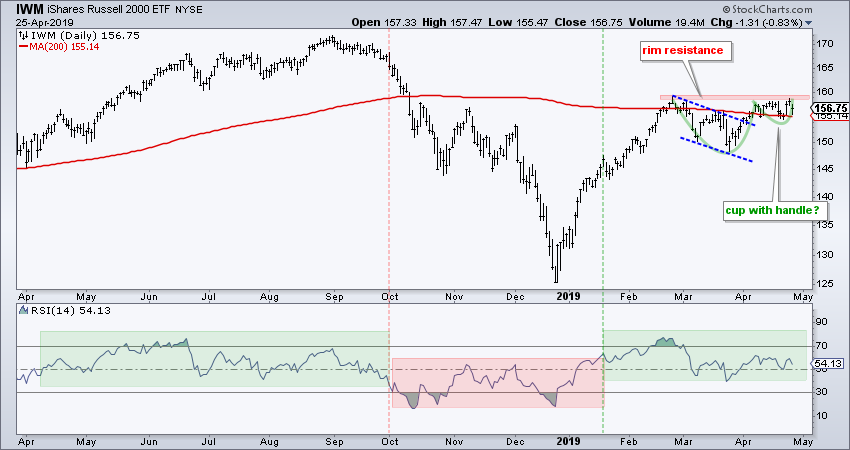
Even though small-caps are lagging, the broad market environment is bullish and the Russell 2000 iShares (IWM) sports a pair of bullish patterns. First, the ETF broke out of a falling flag in early April and this breakout is largely holding. The ETF is also just above its 200-day SMA. IWM surged on Tuesday with the biggest one-day gain since March 11th and I am watching for follow through. A breakout at 160 would produce said follow through and confirm the second bullish pattern, a cup-with-handle. Such a move would argue for a challenge to the August high, which is around 9-10% higher.
Small-caps Breadth Indicators Net Bearish
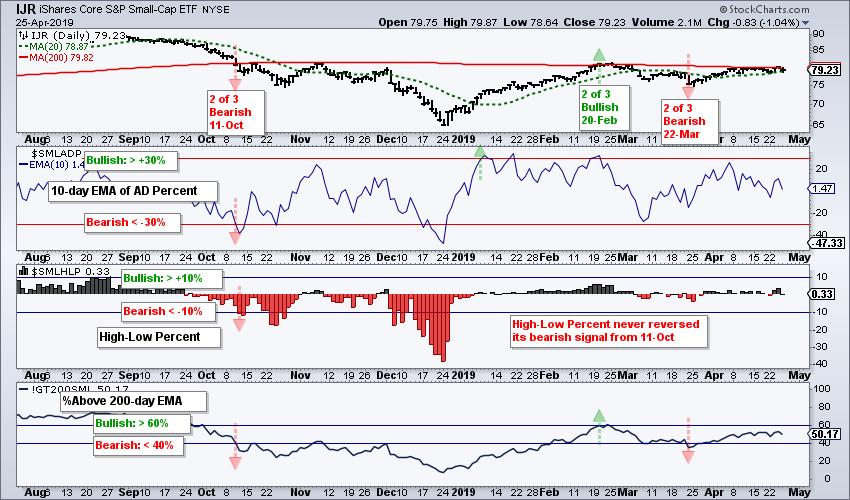
Despite bullish patterns on IWM, the breadth indicators remain net bearish and reflect relative weakness in small-caps. The chart below shows the 10-day EMA of S&P SmallCap AD Percent ($SMLADP) surging above +10% in early January to turn bullish. The Small-Cap %Above 200-day EMA (!GT200SML) followed with a move above 60% on February 20th and the small-cap indicators turned net bullish (two of three). This signal did not last long as the %Above 200-day SMA moved below 40% on March 22nd. The S&P 600 High-Low% ($SMLHLP) triggered bearish with a move below -10% on October 11th and has yet to trigger bullish. Thus, two of the three indicators are currently on bearish signals.
%Above 200-day EMA Hits Milestone for XLF
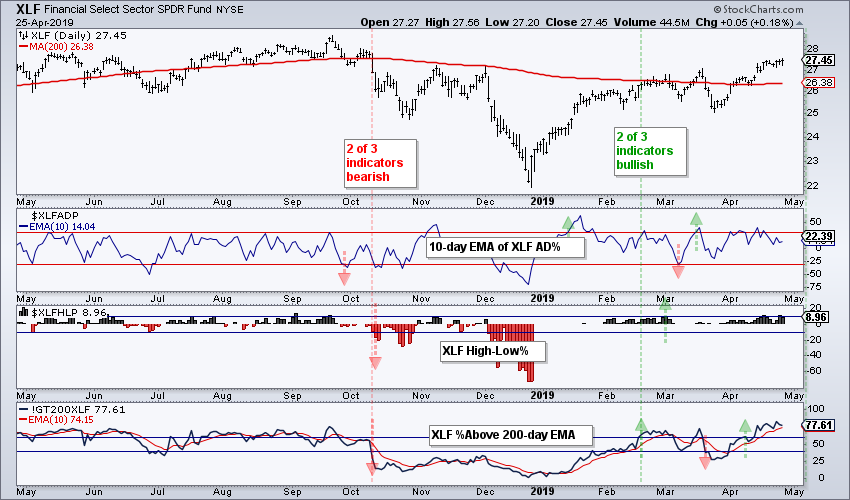
The Financials SPDR (XLF) came to life in April as the Finance %Above 200-day EMA (!GT200XLF) moved above 80% and to its highest level since March 2018. In addition, XLF High-Low% ($XLFHLP) moved above +10% this week as new highs expanded. Overall, the breadth indicators have been net bullish since mid February (green vertical line). This means at least two of the three indicators area on active bullish signals. The 10-day EMA of AD Percent triggered bearish on March 7th, but quickly reversed this signal on March 15th. Thus, the indicators remained "net bullish" throughout March. Given the bullish indicator configuration, I would expect further gains in XLF and a challenge to the September high.
Utilities Correct within Bigger Uptrend
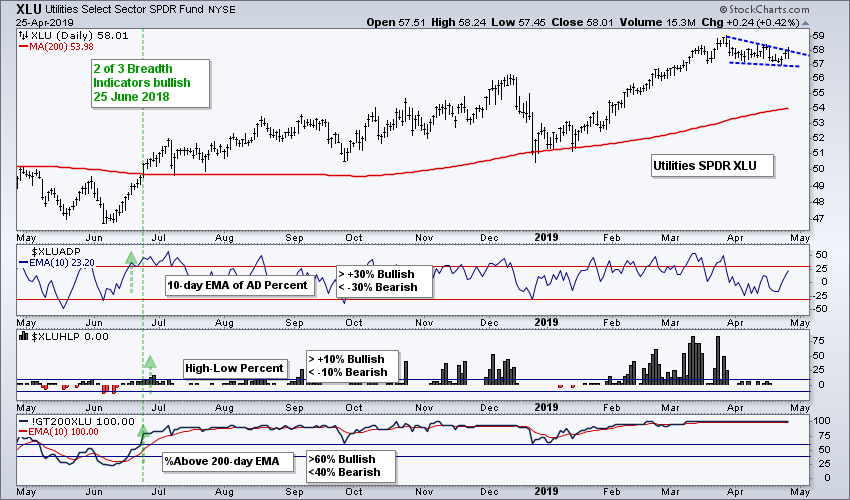
The breadth indicators for the Utilities SPDR (XLU) have been net bullish since June 25th, which is when two of the three were on active bullish signals. High-Low Percent dwindled as XLU corrected in April, but 100% of component stocks are above their 200-day EMAs. The falling wedge here in April looks like a correction within a bigger uptrend and this is a bullish continuation pattern. Watch for a breakout and continuation higher. Note that the 7-10 YR T-Bond ETF (IEF) and 20+ YR T-Bond ETF (TLT) also turned up this week and utilities are bond proxies.
Stock Performance During Earnings Season
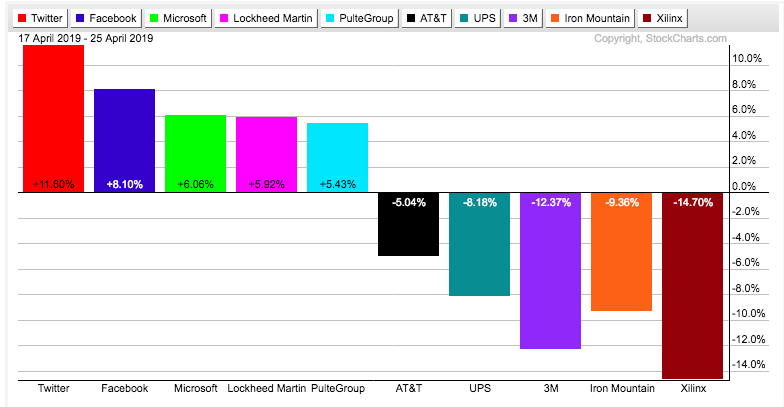
The reaction to earnings has been mixed, but with a positive tilt. I ran a scan of the S&P 500 looking for stocks that advanced more than 5% or declined more than 5%. Most of these moves are earnings-related, but some are not, such as QCOM and APC. Nevertheless, this scan gives us a pretty good idea of how stocks are reacting during the first week of earnings season.
Of the 500 stocks in the index, 41 (8.2%) are up more than 5% over the last five trading days and 33 (6.6%) are down more than 5%. Some of the big gainers include TWTR, FB, MSFT, LMT and PHM. Some of the big decliners include T, UPS, MMM, IRM and XLNX. All ten stocks are still positive year-to-date, all ten were above their 200-day SMAs before their moves and eight of the ten had rising 200-day SMAs (FB and TWTR).
ChartList Updates
Earnings wreaked havoc on MMM and IRM, and there are a few other ChartList names reporting earnings in the next week or two (ED, IAC, SYMC, BERY). These four are higher since being added to the ChartList, but could go either way after earnings. Given the performance of S&P 500 stocks during the first week of earnings season, the odds are a little better than 50% that these stocks will have a positive reaction (50/50 chance).
While I avoid entries when an earnings report is within two weeks, holding into earnings is a tough call. It really depends on your time horizon and trading style. Even so, I think it is important to make the decision ahead of time and have a strategy heading into earnings. In addition, I think one should be consistent with their strategy and have a set of rules. Sell all positions the day before earnings, hold all, sell to lock in profits, sell half to lock in profits, hold when there is a big enough buffer (profit), sell when there is no buffer (profit) etc....
Click here for the Art's Chart ChartList
About the Art's Charts ChartList
The Art's Charts ChartList focuses on stocks and ETFs with stable uptrends and strong momentum. I take a portfolio approach (20-30 positions) to spread risk and keep position sizes relatively small (3-5%). I do not know which picks will work and which will fail. There will be failures and successes as well as slumps and streaks. Hopefully, when measured on a monthly or quarterly basis, the successes will outpace the failures and the net will be positive.
I am not looking for make specific buy/sell recommendations in the Art's Charts ChartList. I add stocks and ETF when I see a setup that makes sense, at least to me. I remove when this setup fails or the rational for the position does not make sense. The term used is "re-evaluation". As an end-of-day trader/investor, I am only interested in closing prices, not intraday swings. Thus, a breach of the re-evaluation level means a rethink is needed. Keep in mind that you, and only you, are responsible for your trading decisions.
Plan your trade and trade your plan.
Arthur Hill, CMT
Senior Technical Analyst, StockCharts.com
Author, Define the Trend and Trade the Trend
Want to stay up to date with Arthur's latest market insights?
– Follow @ArthurHill on Twitter
– Subscribe to Art's Charts
– Watch On Trend on StockCharts TV (Tuesdays / Thursdays at 10:30am ET)


