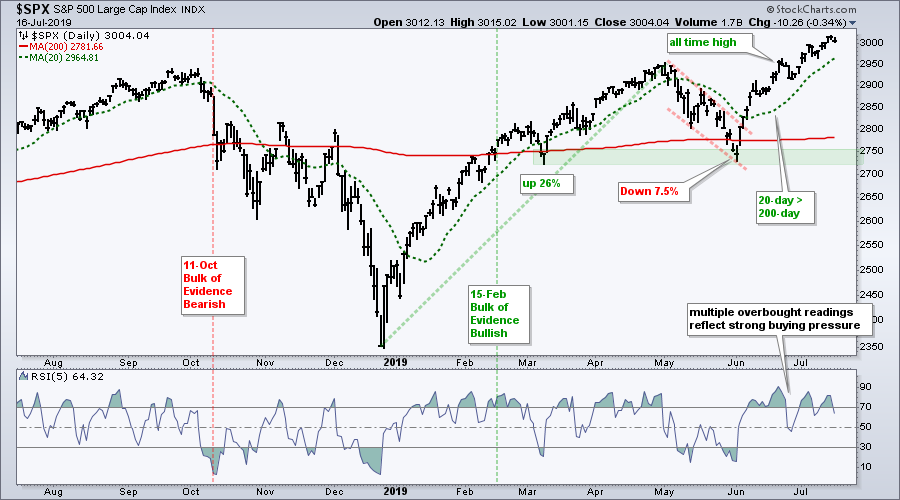
The first step to finding great stocks is establishing the bigger trend for the market, the sector, the industry group and the stock. It is not as hard as it sounds. First, the S&P 500 is clearly in a long-term uptrend because it is above the rising 200-day SMA, the 20-day is above the 200-day and the index hit a new high on Monday. Small-caps are lagging, but the bull market is not over until the S&P 500 cries uncle and I do not hear any whining.
Sealed Air, XLB and $DJUSCP
StockCharts users can easily find the sector and industry group by using the symbols $SECTOR and $INDUSTRY on a SharpChart. These symbols will automatically plot the sector and industry group for a particular stock. Nifty!
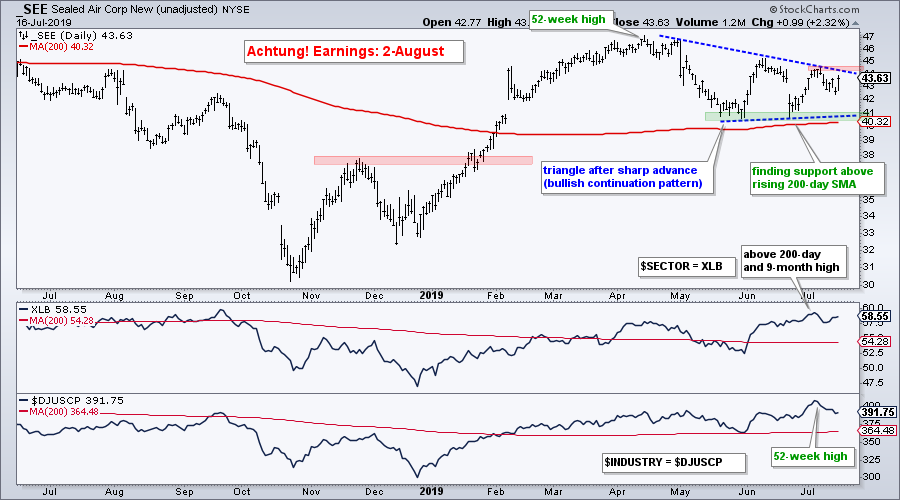 The chart above shows Sealed Air (SEE) with the Materials SPDR (XLB) as $SECTOR and the DJ US Containers and Packaging Index ($DJUSCP) as $INDUSTRY. Notice that both the sector and industry group are above their 200-day SMAs. XLB hit a nine-month high this month and $DJUSCP hit a 52-week high. Both the sector and industry group look strong here. On the price chart, SEE looks poised to break out of a triangle consolidation and this would signal a continuation of the December-April advance.
GE Holds above Wedge Line and 200-day
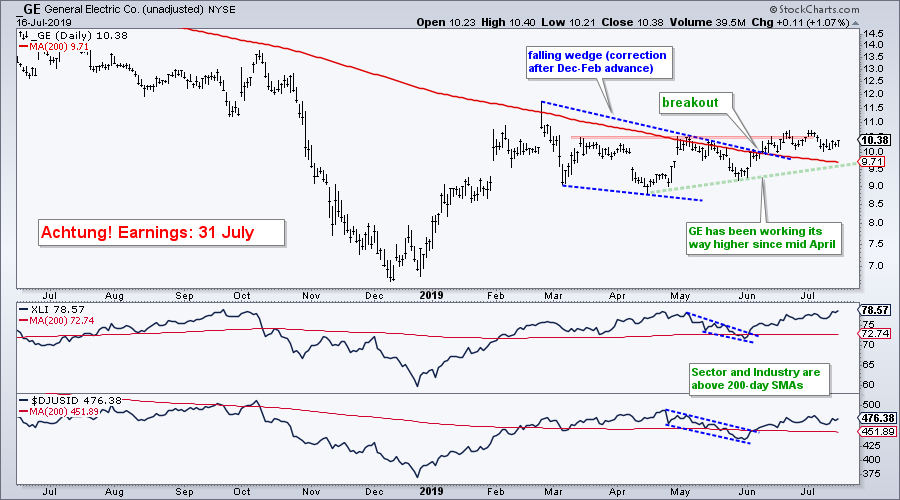
The chart above shows the Industrials SPDR (XLI) above its 200-day and nearing its September high. The Dow Jones Diversified Industrials Index ($DJUSID), in which GE is probably the biggest weighting, is also above its 200-day SMA. GE broke the wedge line and 200-day SMA in June and is holding above these lines.
ITW Breaks Triangle Line
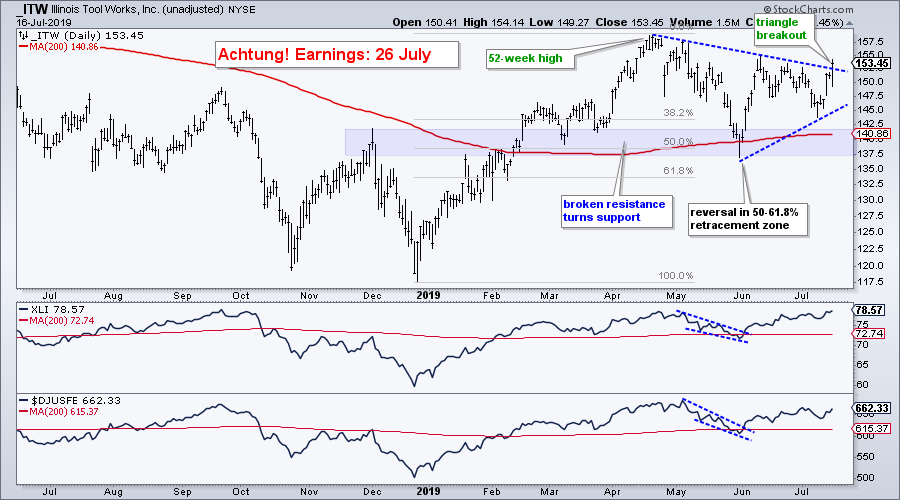
Illinois Tool Works (ITW) fits in the industrials sector and the DJ US Industrial Machinery Industry Group ($DJUSFE). ITW broke out with a surge from late December to April, and hit a 52-week high in April. The stock fell back, but bounced off a classic Reversal Alert Zone (RAZ). This RAZ is marked by broken resistance turned support, support from March lows and the 50-61.8% retracement zone. A triangle formed and the stock broke out with a surge the last four days.
Using ETFs with DR Horton
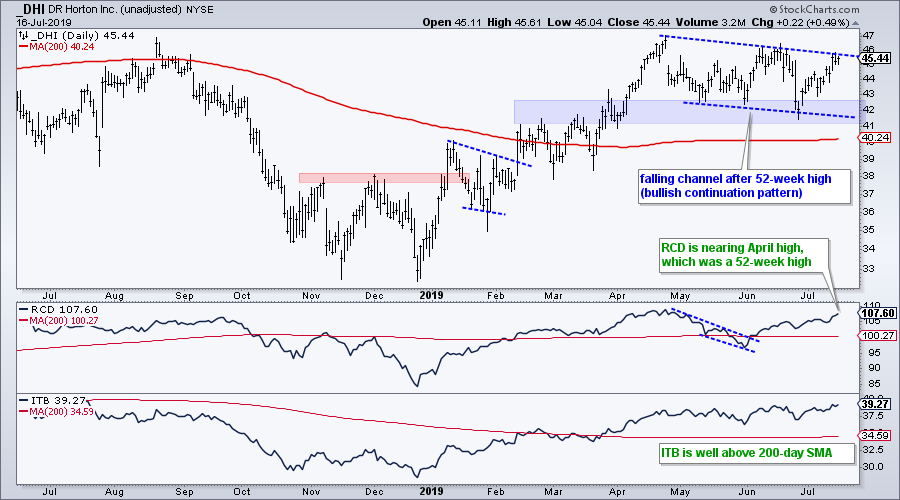
The chart above shows DR Horton (DHI) with the EW Consumer Discretionary ETF (RCD) as the sector and the Home Construction iShares (ITB) as the industry group. I already know that DHI fits in these two groups so I just changed out the $SECTOR and $INDUSTRY symbols. Call it fielders choice! DHI hit a 52-week high in April and then consolidated with a falling channel. Notice that I drew "internal" trend lines that cut through the mid June high and late June low. This is just because I am marking a pattern, which is a bullish continuation pattern. Thus, I expect a breakout and new high in the coming weeks.
50 Stocks in Strong Uptrends
Every week I pour through hundreds of charts and make notes on trends and setups. The comma separated list below contains 50 stocks with strong uptrends. They could be part of a trend-momentum portfolio or part of a watchlist (waiting for a setup). This list can be copied and added to a ChartList or you can copy 12 at a time and view these as CandleGlance charts.
ABT ,AEE ,AEP ,AIV ,AJG ,AZO ,BLL ,BSX ,CCI ,CDNS ,CHD ,CMCSA ,COUP ,CYBR ,DENN ,DG ,DRI ,HCP ,HSY ,INTU ,IQV ,MA ,MCD ,MRK ,MSFT ,MSI ,ORLY ,PEP ,PG ,PLNT ,PYPL ,RSG ,SBAC ,SBUX ,TMO ,TMUS ,TSCO ,TSCO ,TTD ,TWLO ,V ,VRSN ,VTR ,WDAY ,WELL ,WING ,WK ,WM ,WPC ,YUM
On Trend on YouTube (Tuesday, July 17th)
- Small and Mid Caps Stall Out
- Semiconductors: SOXX vs XSD
- Focus on Homebuilders (ITB and 7 Stocks)
- Stocks: Three Bullish Setups
- Click here to Watch
Arthur Hill, CMT
Senior Technical Analyst, StockCharts.com
Author: Define the Trend and Trade the Trend
Paper: RSI for Trend-Following and Momentum Strategies
Want to stay up to date with the latest market insights from Arthur?
– Follow @ArthurHill on Twitter
– Subscribe to Art's Charts
– Watch On Trend on StockCharts TV (Tuesdays / Thursdays at 10:30am ET)


