 The S&P 500 is the most widely used benchmark for the US stock market and the 200-day SMA is perhaps the most widely used moving average. These two came together again in late May as the index crossed back above on May 27th. Today we will quantify the performance of prior signals and show how a little smoothing can go a long way. Furthermore, a simple market timing mechanism can tell investors when to add risk and when to seek alternatives to stocks.
Note that this article was revised on June 10th. The original numbers were based on a backtest to 2001. The new numbers show results since 1/1/2000.
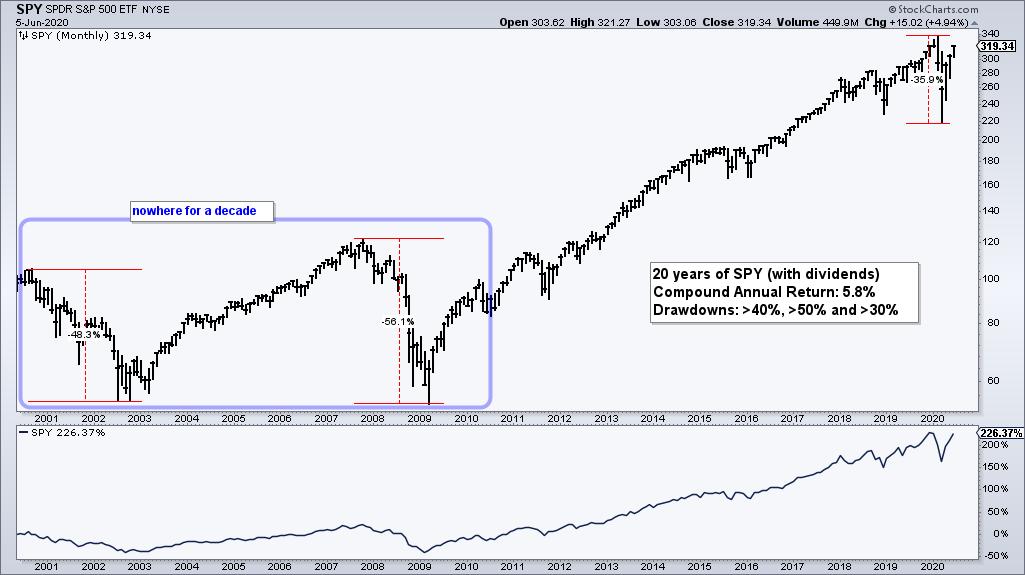
Instead of using the S&P 500 Index, I will use the S&P 500 SPDR (SPY). Let's first look at returns over the last twenty years. The first half marks the lost decade when SPY went nowhere from June 2000 to June 2010. There were two big declines during this decade and a major low in March 2009. The second decade was much better, but also experienced a 30+ percent decline in 2020. Over the entire 20 year period, SPY returned 5.8% per year with dividends included.
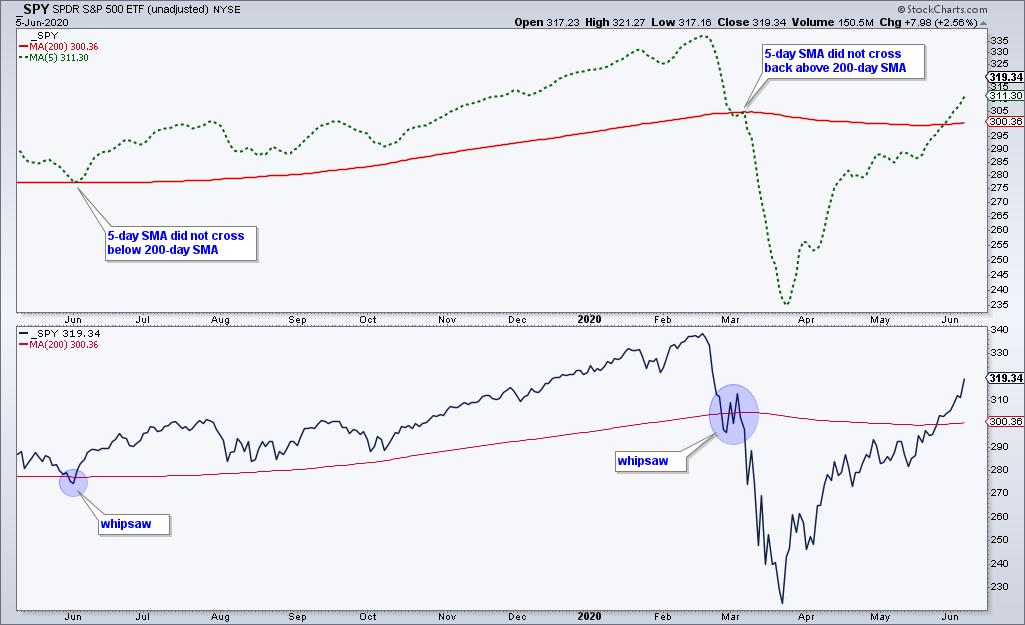
Now let's look at some moving average crosses. The next chart shows SPY with the 5-day SMA and 200-day SMA in the upper window and SPY with the 200-day SMA in the lower window. SPY moved above its 200-day SMA on May 27th and this was the 147th time in the last 20 years. Talk about a lot of signals. The 5-day SMA moved above the 200-day SMA on May 29th and this marked the 63rd cross. Smoothing with a short 5 day SMA cut the total number of signals by more than half and reduced whipsaws.
Now let's quantify these signals with a backtest. The table below shows results for buy-and-hold on the first line and different moving average crosses on the following lines. Buying and selling on a cross of the 200-day SMA is profitable with much lower drawdowns than buy-and-hold, but there are a lot of whipsaws (bad trades) because the win percent is only 30%. Notice that the Compound Annual Return and Win% increase significantly when we smooth the close with a 5-day SMA.
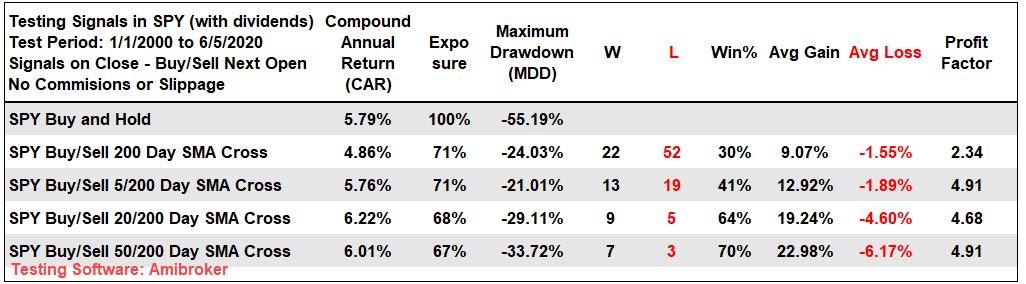
Returns increase slightly as we move from a 5-day SMA to a 20-day to a 50-day, and the Win% increases rather dramatically. However, the Profit Factor does not improve and this suggests that the 5/200 day cross is just as profitable as the 50/200 day cross, and with much lower drawdowns (-21% versus -34%).
Even though the 5/200 day SMA combo does not outperform buy-and-hold over the twenty year period, employing a simple market timing mechanism can help one avoid some big drawdowns. Notice that this timing strategy was only invested 71% of the time, which means money could have been put to work outside of the stock market 29% of the time. Chartists can also use this strategy to adjust risk in their portfolios. For instance, one could add risk and increase stock exposure when the 5-day is above the 200-day, and turn defensive when the 5-day is below the 200-day.
There is a lot of chatter recently concerning the medium-term breadth thrust in the percentage of stocks above the 50-day SMA. At TrendInvestorPro, I put this thrust to the test and quantified results going back to 2001. I also proposed and tested a model using the percentage above indicator for three SMAs for the S&P 500. Click here to subscribe and get immediate access to this report and much more.
Click here to take your analysis process to the next level!
-----------------------------------------------
Choose a Strategy, Develop a Plan and Follow a Process
Arthur Hill, CMT
Chief Technical Strategist, TrendInvestorPro.com
Author, Define the Trend and Trade the Trend
Want to stay up to date with Arthur's latest market insights?
– Follow @ArthurHill on Twitter


