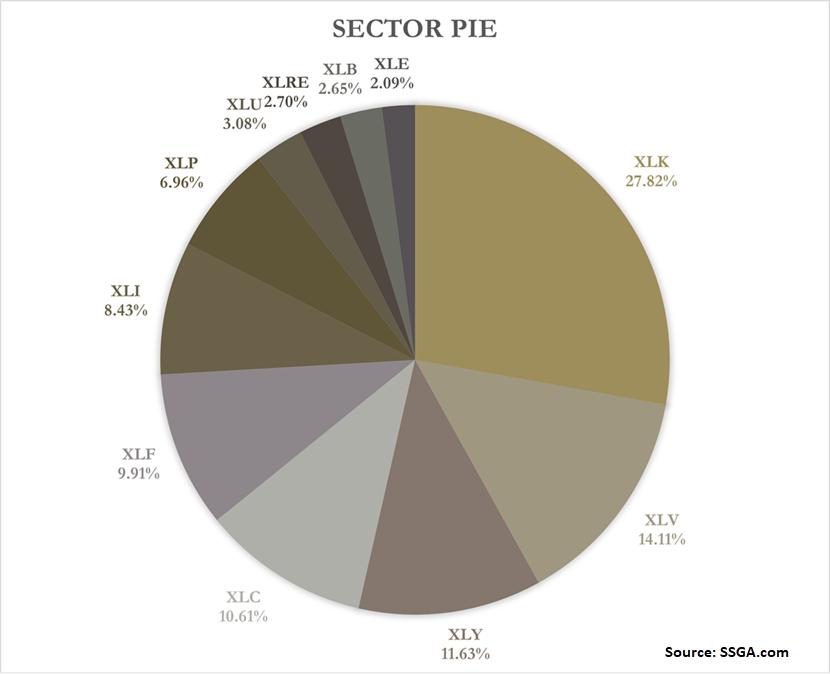
There are 11 sectors in the S&P 500, but the big six are the only ones we need to be concerned with when making a broad market assessment. The big six account for a whopping 82.5% of the S&P 500, which leaves the other 5 with just 17.5%. Consumer Staples is the seventh biggest sector (7%) and this leaves the remaining four to divide up 10.5% of the pie. Focusing on these six, I am seeing broad participation behind the advance of the last two weeks and this is bullish for the broader market.
Chartists can use Advance-Decline Percent to measure the "degree" of participation behind a move. This breadth indicator shows net advances (advances less declines) as a percentage of the total stocks in the sector. I apply a 10-day EMA to smooth fluctuations and capture rolling two week participation. A surge above +30% shows strong upside participation and this is considered a bullish breadth thrust. A plunge below -30% shows strong downside participation and this is a bearish breadth thrust.
Market moves backed by breadth thrusts in the majority of sectors carry more weight and have a better chance of continuing. It is like a rocket lifting off. The chart below shows the 10-day EMA of AD% for the six big sectors. The green circles highlight bullish breadth thrusts, while the red circles identify bearish breadth thrusts. Working from left to right, we can see 5 of 6 triggering bearish in early August 2019, 5 of 6 triggering bullish in early September 2019, 6 of 6 triggering bearish in late February 2020 and 6 of 6 triggering bullish in late April 2020. The S&P 500 is in the middle to measure the subsequent moves.
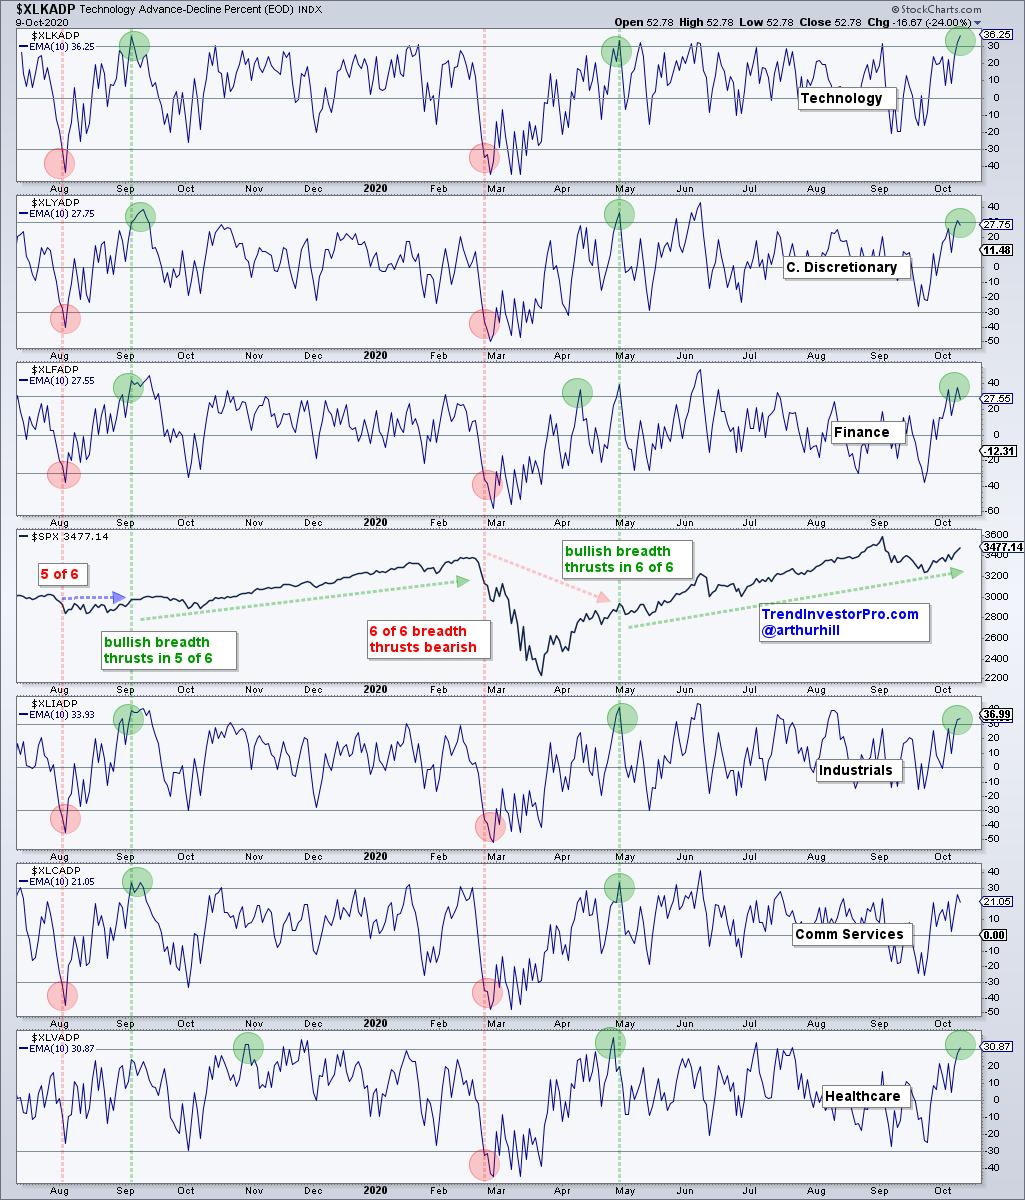
The bearish signal in August 2019 did not lead to a decline, but the next three signals proved quite timely (red and green vertical lines). There was second majority bullish thrust in early June when 5 of 6 triggered bullish. I did not mark this signal because there was already an active bullish signal from late April. Stocks consolidated after this thrust and then continued higher.
Most recently we saw bullish breadth thrusts in 5 of the 6 biggest sectors last week. This reflects broad upside participation and affirms the bull market. Communication Services was the only sector to fall short and is lagging somewhat. Overall, I would remain bullish on stocks until we see bearish breadth thrusts in four of the big six.
You can find this chart and more than 100 customized breadth charts in the Essential Breadth ChartList, which is available to TrendInvestorPro subscribers. This list is organized in a top-down manner covering an array of breadth indicators: AD Lines, AD Volume Lines, High-Low Percent, Percent Golden/Silver Crosses, %Above 200-day SMA and many more. Click here to get your list and access to our breadth models, ETF report, weekend video and more.
----------------------------------------------------
Choose a Strategy, Develop a Plan and Follow a Process
Arthur Hill, CMT
Chief Technical Strategist, TrendInvestorPro.com
Author, Define the Trend and Trade the Trend
Want to stay up to date with Arthur's latest market insights?
– Follow @ArthurHill on Twitter


