Art's Charts January 30, 2021 at 10:21 AM
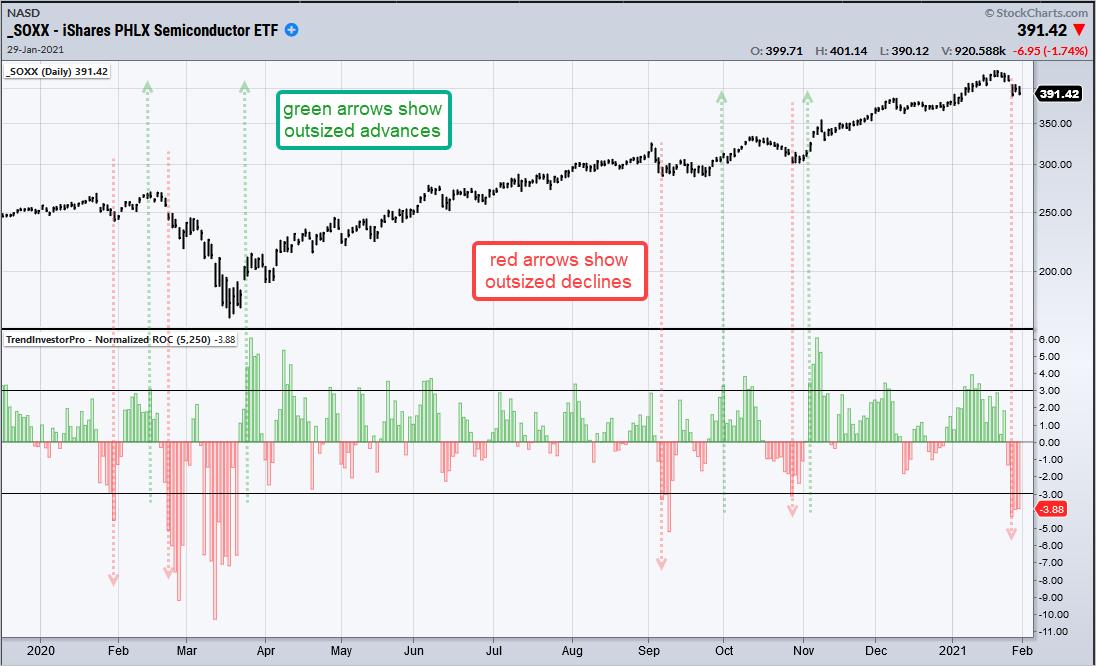
Last weekend's post showed the Semiconductor ETF (SOXX) with a 10 day overbought streak and several ETFs with even bigger overbought streaks. These streaks came to an end this week as SOXX fell 6.21%, its biggest weekly decline since mid March... Read More
Art's Charts January 18, 2021 at 09:22 AM

Visual chart analysis is prone to subjectivity and biases. While we cannot completely remove subjectivity, we can approach chart analysis in a systematic fashion and increase objectivity... Read More