 Visual chart analysis is prone to subjectivity and biases. While we cannot completely remove subjectivity, we can approach chart analysis in a systematic fashion and increase objectivity. This commentary will show an example using the Home Construction ETF (ITB) because the ETF has traded flat since mid October. Is this a top or merely a correction?
First things first. What is the direction of the bigger trend? Three indications point to an uptrend. First, the ETF exceeded its February high in July and recorded 52-week highs into October. Second, ITB is above the 200-day SMA and the 200-day SMA is rising. Third, the RSI Trend-Range (65,5) indicator turned bullish in late May and remains bullish. This is the 5-day SMA of 65-day RSI and this indicator is part of the TIP Indicator Edge Plugin for StockCharts ACP. It turns bullish with a move above 51 (green) and bearish with a move below 49 (red).
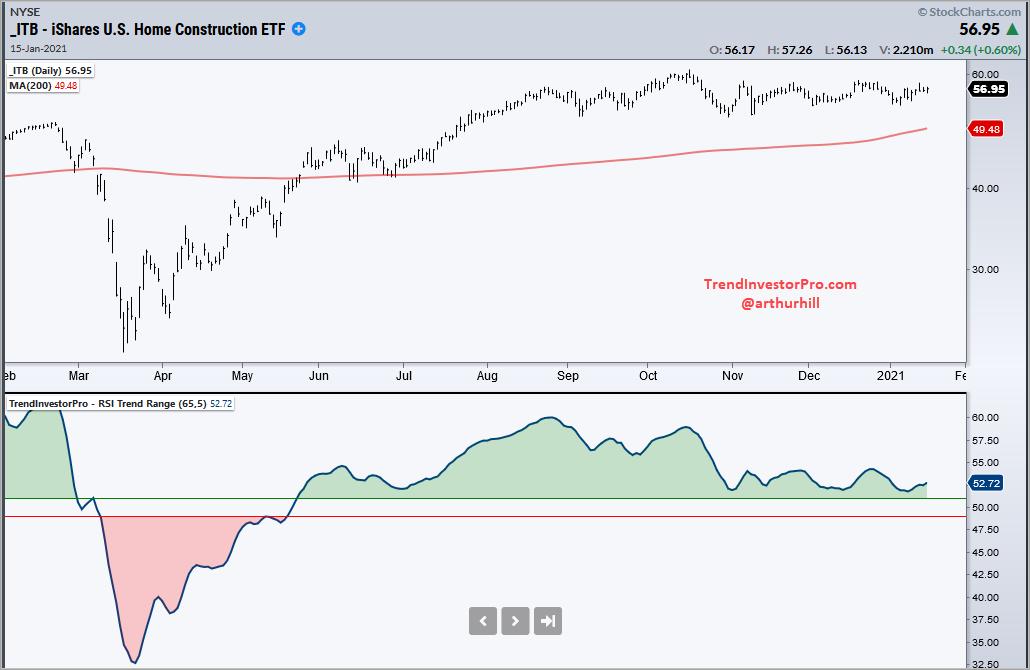
Now that we have established that the bigger trend is up, we can set our trading bias as bullish. This means I will focus on bullish setups and expect bullish outcomes because the odds favor a move in the direction of the bigger trend. Consolidations are considered mere pauses within the uptrend and pullbacks are viewed as opportunities, not threats.
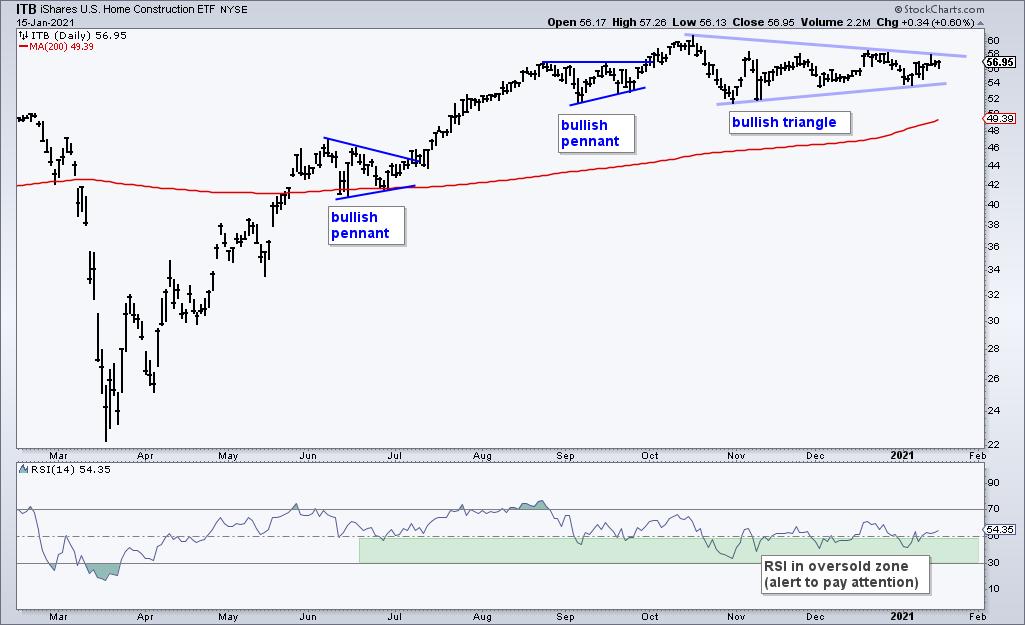
The next chart shows ITB with bullish continuation patterns marked in blue and oversold RSI marked with green shading. An RSI move into the 30-50 zone denotes an oversold condition of varying degrees and alerts chartists to be on guard for a bullish setup. RSI has been flirting with this zone for several months as ITB consolidates with a long and narrowing triangle. Prices are winding up and the expectation is for an upside breakout. Why? I think you can figure that one out! A breakout would signal an end to the pause (correction) and a continuation of the bigger uptrend.
Looking for a systematic approach to quantify trends and be alerted to bullish setups within uptrends? TrendInvestorPro tracks trend strength, trend signals and oversold setups for 118 ETFs. The table below shows a subset with six oversold setups. This week we highlighted the Residential REIT ETF (REZ) and Utilities SPDR (XLU). Click here to subscribe and get immediate access to this table, the weekend video and premium commentary.
-----------------------------------------
Choose a Strategy, Develop a Plan and Follow a Process
Arthur Hill, CMT
Chief Technical Strategist, TrendInvestorPro.com
Author, Define the Trend and Trade the Trend
Want to stay up to date with Arthur's latest market insights?
– Follow @ArthurHill on Twitter


