Not all ETFs are created equal and the name does not always tell the entire story. One would think that the Industrials SPDR (XLI) and the Industrials iShares (IYJ) are similar in makeup and performance. This is not the case because one has a clear edge over the other.
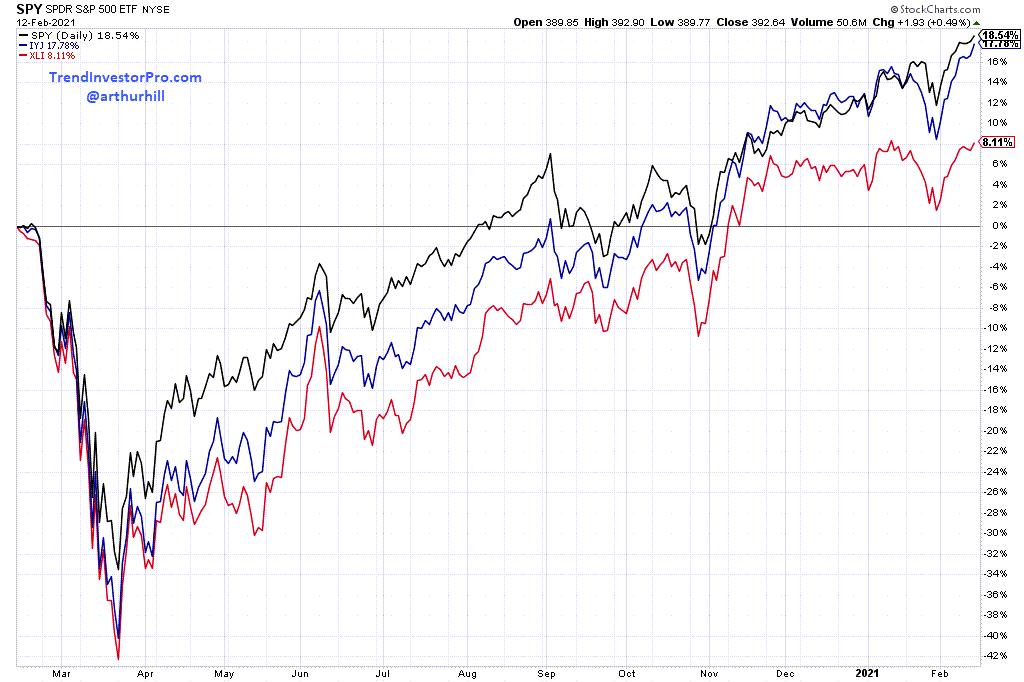
The Industrials iShares is stronger than the Industrials SPDR because it already hit a new high this week and is up much more than XLI over the last 12 months. On a total return basis (dividends included), SPY is up 18.54%, IYJ is up 17.78% and XLI is up just 8.11%. SPY and IYJ are outperforming because they both have a healthy weighting from the technology sector. Yes, you read right. According to the iShares website, the Software & Services Industry Group accounts for 22.7% of the Industrials iShares. Who would have thought!
Let's first look at the chart for IYJ. The ETF is in a long-term uptrend because it is above its rising 200-day SMA and closed at a new high on Friday. The blue shaded areas show consolidations within the bigger uptrend. IYJ consolidated in September-October and then broke out to new highs. The ETF then consolidated from late November to early February and again broke out to new highs. A consolidation within a bigger uptrend is a bullish continuation pattern and the breakout signals a continuation of this uptrend.
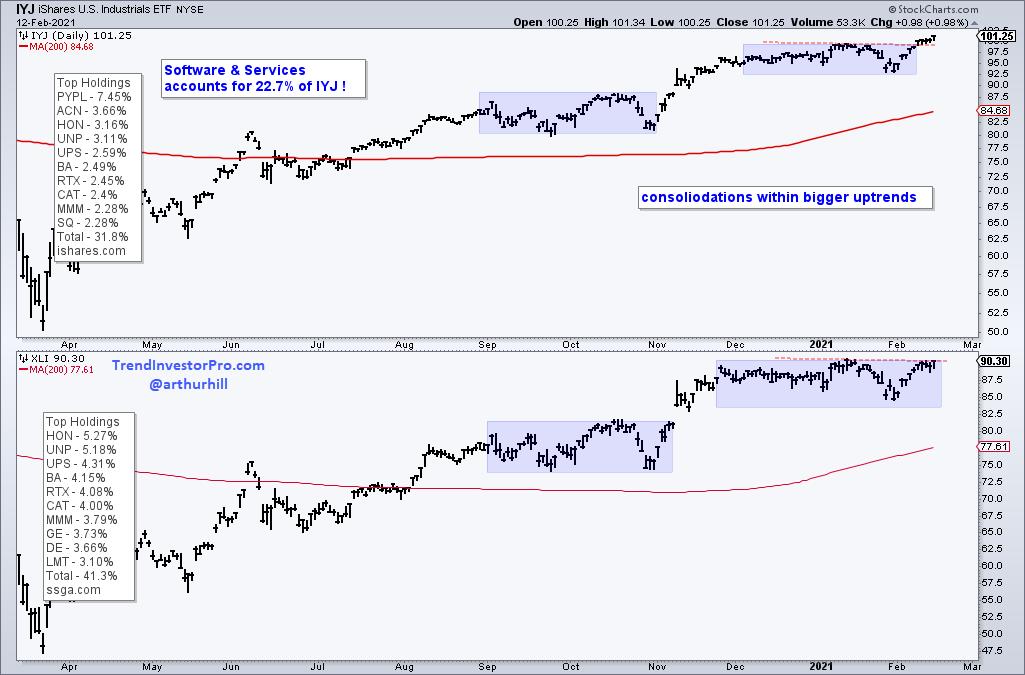
Now let's look at XLI. The trend is also up and the ETF also formed two bullish continuation patterns within this uptrend. XLI is currently challenging resistance from the current consolidation and a breakout would argue for a continuation of the uptrend.
Even though both charts are bullish, it is clear that IYJ is stronger than XLI. The tech-related components, such as Paypal (PYPL), Accenture (CAN) and Square (SQ), add a little more juice to IYJ and should help it continue to outperform the XLI.
SPY, QQQ, IWM and over 50 ETFs in our Core List recorded new highs this week. Most of these ETFs were short-term oversold in late January and strong mean-reversion bounces materialize. Now what? Check out TrendInvestorPro.com for our weekly ETF Trends, Patterns and Setups Report, Market Timing Report and Comprehensive Weekend Video. Click here to subscribe and get immediate access.
---------------------------------------------------
Choose a Strategy, Develop a Plan and Follow a Process
Arthur Hill, CMT
Chief Technical Strategist, TrendInvestorPro.com
Author, Define the Trend and Trade the Trend
Want to stay up to date with Arthur's latest market insights?
– Follow @ArthurHill on Twitter


