The S&P SmallCap 600 SPDR (IJR) and Russell 2000 ETF (IWM) are lagging the market, but they are still in uptrends and the noose is tightening. Today we will look at the volatility contraction in IJR and the loss of trend in IWM, and then show what to watch going forward.
The first chart shows IJR with Bollinger Bands, BandWidth and %B. We can use this trio to quantify volatility contractions and identify a breakout. Narrowing bands point to a volatility contraction and BandWidth measures the percentage distance between the bands. Notice that BandWidth dipped below 5% for the fourth volatility contraction this year.
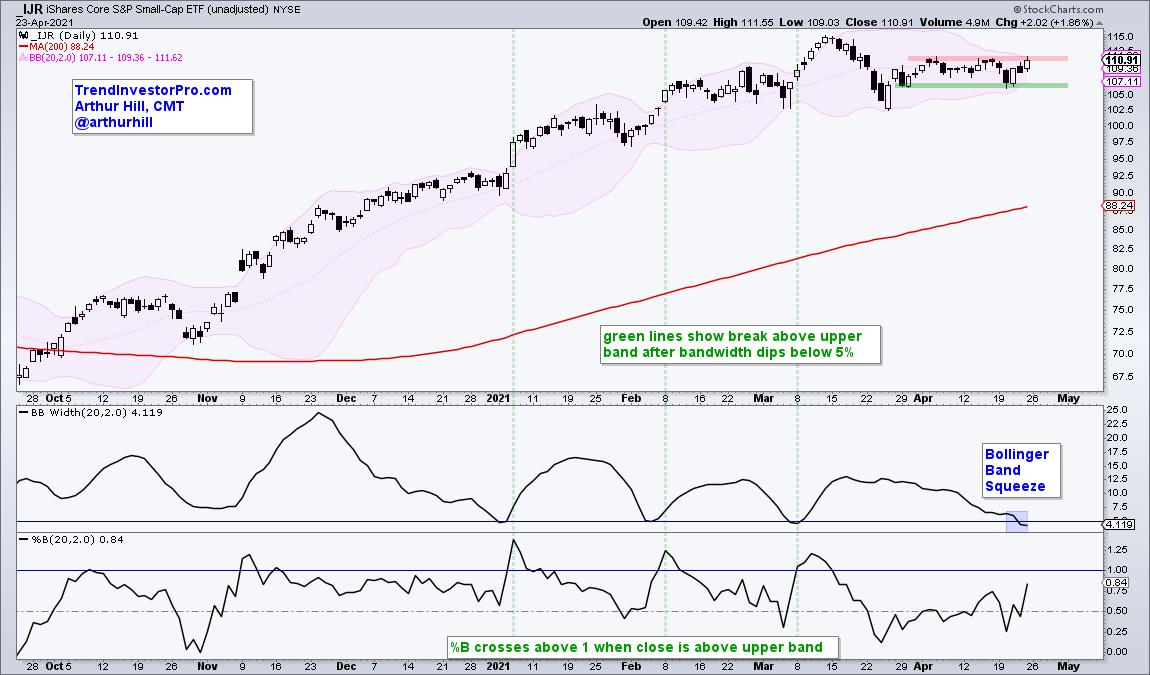
The volatility contraction does not provide a directional clue so we must cue off the price charts for a signal. First, we are in a bull market. Second, note that IJR hit a new high in mid March and remains well above the rising 200-day. The bull market and uptrend favor further upside. A break above the mid April highs and upper band would be bullish and argue for a continuation of the bigger uptrend. We can quantify a band break by looking for %B to cross above 1 (green dashed lines).
The next chart shows IWM with the Average Directional Index (ADX). This indicator measures the strength of the trend, be it up or down. In general, the trend is strong when ADX is above 25 (green shading) and weak when ADX is around 20 (blue shading). We can see that the IWM trend weakened in early March and remains weak.
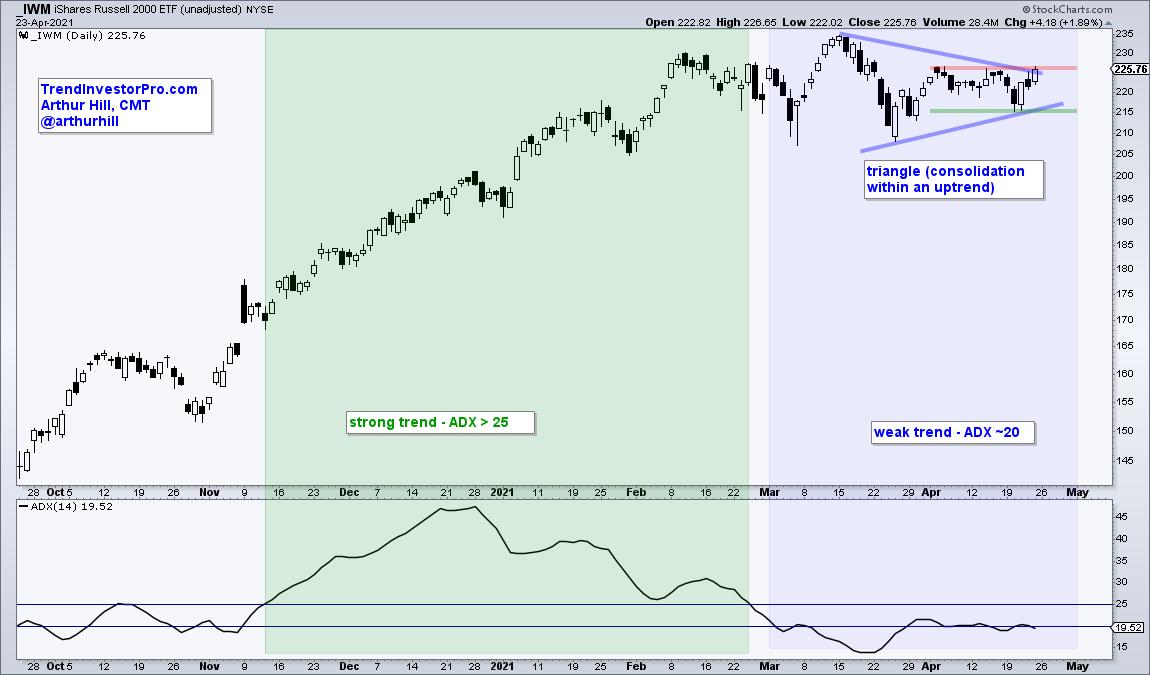
As with IJR, the long-term trend is up for IWM because the ETF hit a new high in mid March and remains above its 200-day. A triangle formed the last six weeks and this is a continuation pattern. This triangle has a bullish bias because the longer term trend is up and the odds for an upside breakout.
This week in the ETF Trends, Patterns and Setups Report at TrendInvestorPro, we identified a clean energy ETF that is outperforming its peers, a growth ETF with signs of a breakout and a cannabis ETF with a bullish configuration. Click here to subscribe and get immediate access.
---------------------------------------------------------
Choose a Strategy, Develop a Plan and Follow a Process
Arthur Hill, CMT
Chief Technical Strategist, TrendInvestorPro.com
Author, Define the Trend and Trade the Trend
Want to stay up to date with Arthur's latest market insights?
– Follow @ArthurHill on Twitter


