 There are two commodity ETFs with falling wedge patterns working. One falling wedge resulted in a deep pullback and the other in a shallow pullback. Either way, I view these falling wedges as corrections within uptrends and am watching for breakouts. This article will look at the deep pullback in the Palladium ETF (PALL).
The falling wedge is a classic pattern that often forms as a correction within a bigger uptrend. First, there is some sort of uptrend present and/or a powerful move that signals the start of an uptrend. Second, there is a pullback that retraces a portion of the prior move and holds well above the prior low. Sometimes the pullback is deep and sometimes shallow. The correction ends when price breaks out of the wedge. This signals a resumption of the bigger uptrend and argues for further gains.
The chart below shows PALL with a ~100% advance that broke above the October-November highs and hit a 52-week high in March. The ETF then embarked on a ~40% decline that retraced well more than 2/3 of this advance and did not hold near the January breakout zone. A normal correction would retrace around 50% and hold the prior breakout. This one did not, but I still think it is a correction within a bigger uptrend because the prior 105% advance was also atypical. In other words, a big advance deserves a big correction. Such is the nature of subjective analysis.
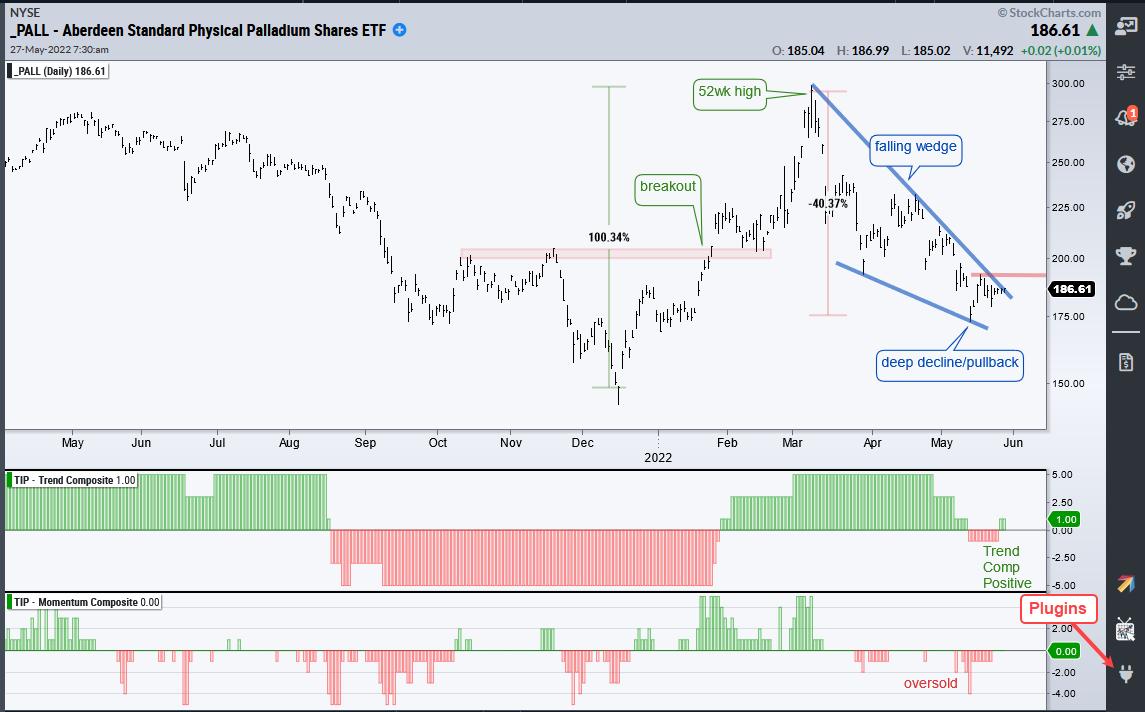
The first indicator window shows the Trend Composite turning negative for two weeks and the Momentum Composite dipping to -5 (oversold) on May 12th. The Trend Composite flipped back to positive this week and I am now watching for a wedge breakout. A break above last week's high could provide the first clue that this correction is ending and the immediate downtrend is reversing. The second commodity ETF with a falling wedge is reserved for subscribers.
This week at TrendInvestorPro we covered the new signals in the Latin America 40 ETF (ILF), Gold SPDR (GLD) and Agribusiness ETF (MOO). There are chart-packed ETF Reports on Tuesdays and Thursdays, a comprehensive video on Wednesdays and a market regime update on Wednesdays. Click here for immediate access.
In this week's Next Level Charting video (here), I showed how to use the Trend Composite and the ATR Trailing Stop as part of a trend-following strategy. We also looked at relative strength in XLV and MOO, and showed how to pick a level to prove your trade wrong.
The Trend Composite, Momentum Composite, ATR Trailing Stop and eight other indicators are part of the TIP Indicator Edge Plugin for StockCharts ACP. Click here to take your analysis process to the next level.
---------------------------------------
Choose a Strategy, Develop a Plan and Follow a Process
Arthur Hill, CMT
Chief Technical Strategist, TrendInvestorPro.com
Author, Define the Trend and Trade the Trend
Want to stay up to date with Arthur's latest market insights?
– Follow @ArthurHill on Twitter


