 Traders can improve the odds of success by focusing on ETFs in leading uptrends. TrendInvestorPro identifies such ETFs with a table that shows Trend Composite signals and the 52-week range indicator. These ETFs are then singled out for chart analysis and we are featuring the DB Energy ETF (DBE) today.
The table below shows the top performing ETFs within the All Weather List, which contains 36 stock-based ETFs and 14 non-stock ETFs. It is sorted by the 52-wk Range column (right). ETFs with scores above 90 are near 52-week highs (UUP), ETFs with scores near 50 are in the middle of their one year range (XES) and ETFs with scores below 10 are near 52-week lows (GDX). This table shows the top ten for reference.
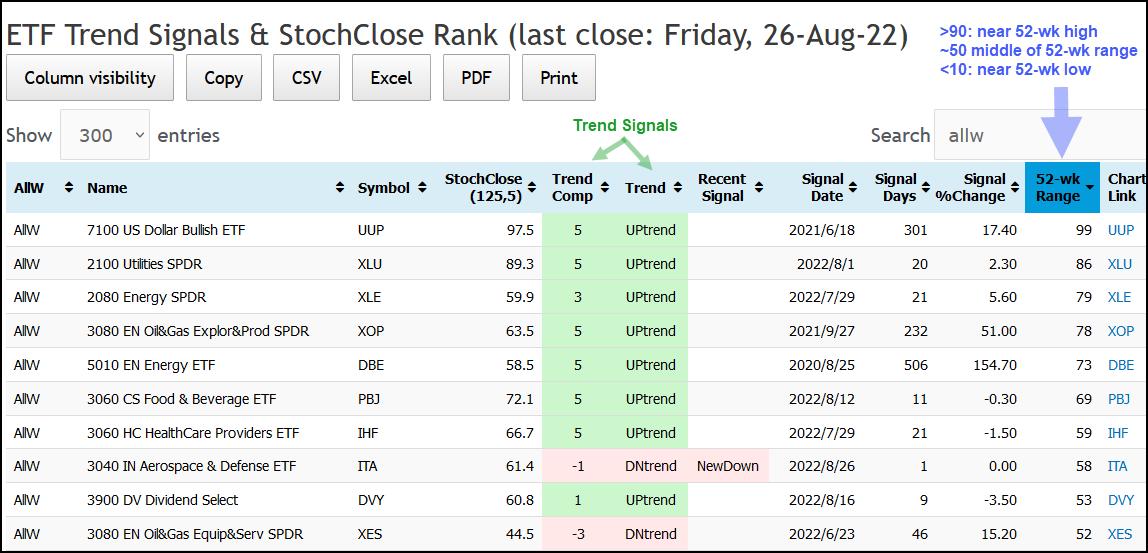
The Dollar Bullish ETF (UUP) is by far the strongest with a value of 99, and near a 52-week high. The Utilities SPDR (XLU) is second with a value of 86. We then have three energy-related ETFs: the Energy SPDR (XLE), Oil & Gas Exploration & Production ETF (XOP) and DB Energy ETF (DBE). In fact, four of the top ten are energy-related with the Oil & Gas Equipment & Services ETF (XES) bringing up the rear.
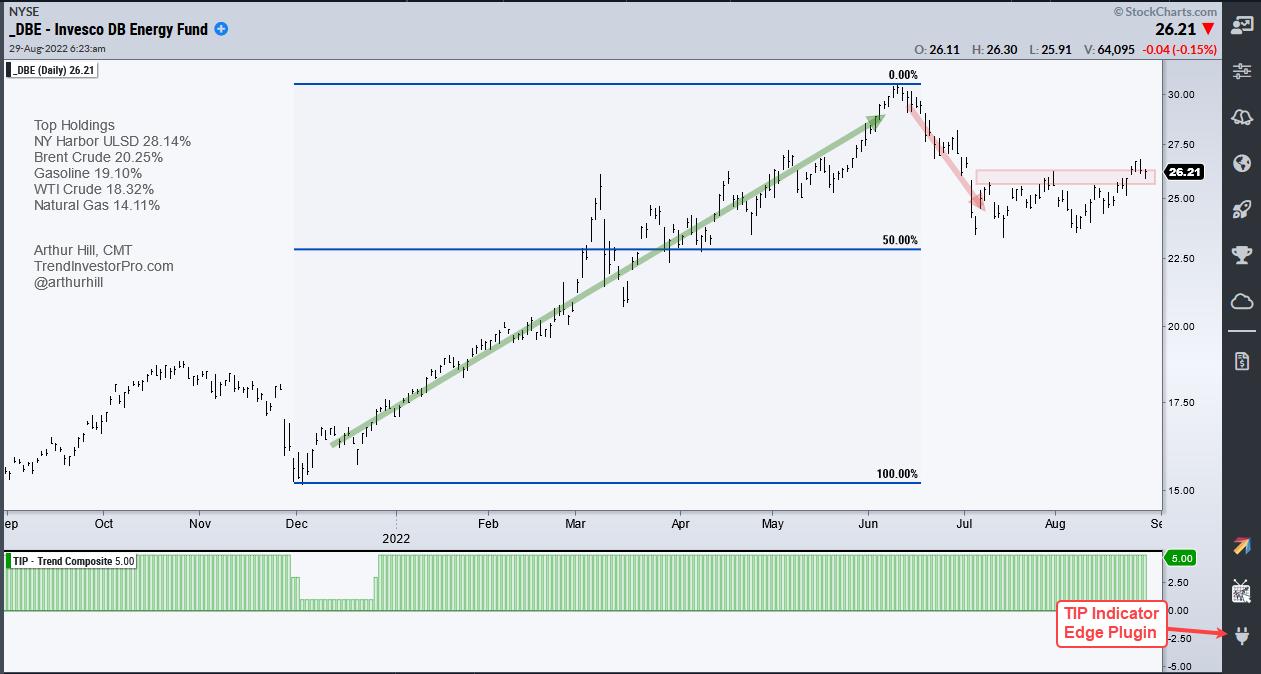
The table above also shows the Trend Composite signals with the signal dates and percentage change since the signal (middle columns). The DB Energy ETF (DBE) has been in an uptrend for over 500 trading days. My basic strategy is to identify tradable pullbacks within uptrends and DBE fits the bill right now. The ETF hit a new high in June and retraced half of the December-June advance with a decline into the 23 area (50% on chart). Think of this as two steps forward (green arrow) and one step backward (red arrow). DBE then firmed into August and is on the verge of breaking resistance (red shading). A breakout would signal an end to the correction (one step backward) and a resumption of the bigger uptrend (two steps forward).
The vast majority of stock-based ETFs in the TrendInvestorPro universe are in downtrends and the Composite Breadth Model has been bearish since April 11th. This means the focus should be on ETFs with lower correlations to broad market movements and on non-stock ETFs. As such, our recent focus has been on inflation-index bond ETFs, energy ETFs and agriculture ETFs. Click here for immediate access to our reports and weekly video.
The StochClose, the Trend Composite, ATR Trailing Stop and eight other indicators are part of the TIP Indicator Edge Plugin for StockCharts ACP. Click here to take your analysis process to the next level.
---------------------------------------
Choose a Strategy, Develop a Plan and Follow a Process
Arthur Hill, CMT
Chief Technical Strategist, TrendInvestorPro.com
Author, Define the Trend and Trade the Trend
Want to stay up to date with Arthur's latest market insights?
– Follow @ArthurHill on Twitter


