The S&P 500 SPDR (SPY) is in the midst of a strong advance since mid July as it became "overbought" on July 20th and remains overbought. Today's article will show how to measure overbought and oversold levels using StochClose, which is a version of the Stochastic Oscillator that uses closing prices. We will then backtest SPY using overbought and oversold signals. Shout out to Rob Hanna of QuantifiableEdges.com for the inspiration behind this article.
The Stochastic Oscillator measures the level of the close or current price relative to the intraday high-low range. StochClose also measures the level of the close relative to the high-low range, but uses the "closing" prices only (as opposed to the intraday high-low range). This is why I am only showing a line chart (close only) for SPY. Readings above 80 mean price is near the top of its 14-day range and readings below 20 mean price is near the bottom of its 14-day range. As with traditional Stochastic (14,3), I also smoothed 14-day StochClose with a 3-day SMA. StochClose is part of the TrendInvestorPro indicator edge plugin for StockCharts ACP.
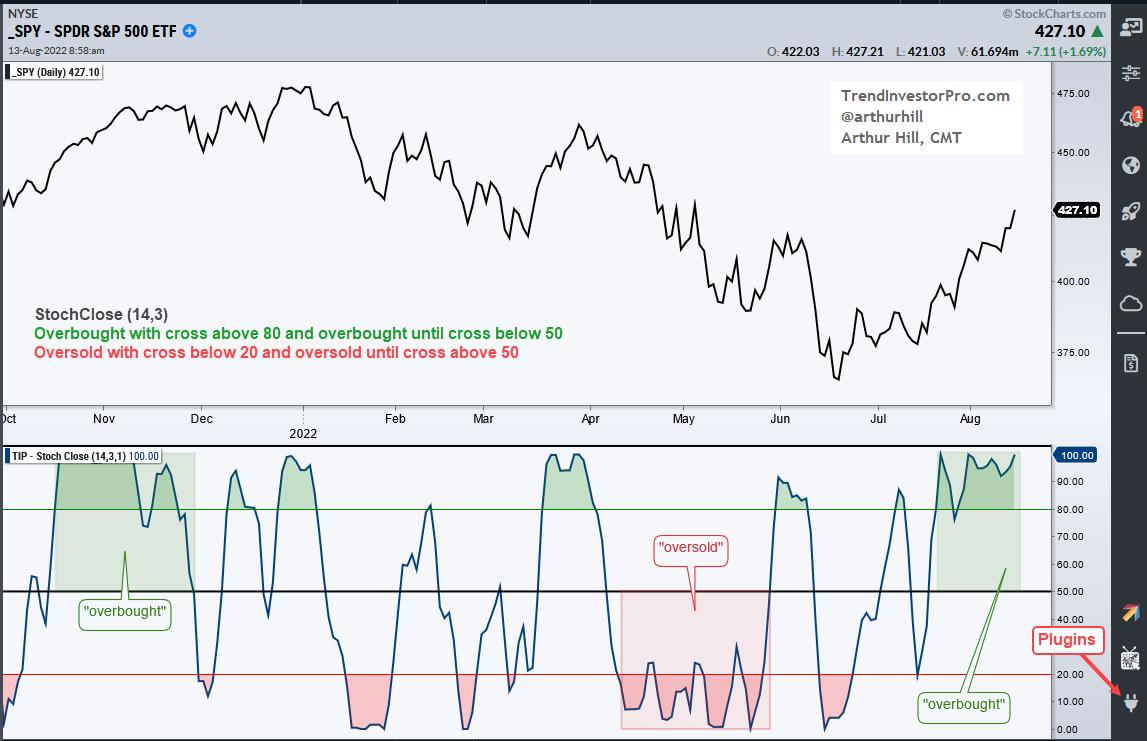
For testing purposes, an overbought period will start with a move above 80 and end with a move below 50. Oversold will start with a move below 20 and end with a move above 50. Signals are based on the close and the buy/sell occur the next open. For example, the strategy will buy SPY on the open the day after StochClose crosses above 80 and sell on the open the day after StochClose crosses below 50. The tests ran from January 2000 until August 11th, 2022. There are no commissions or dividends. The charts below show signal examples.
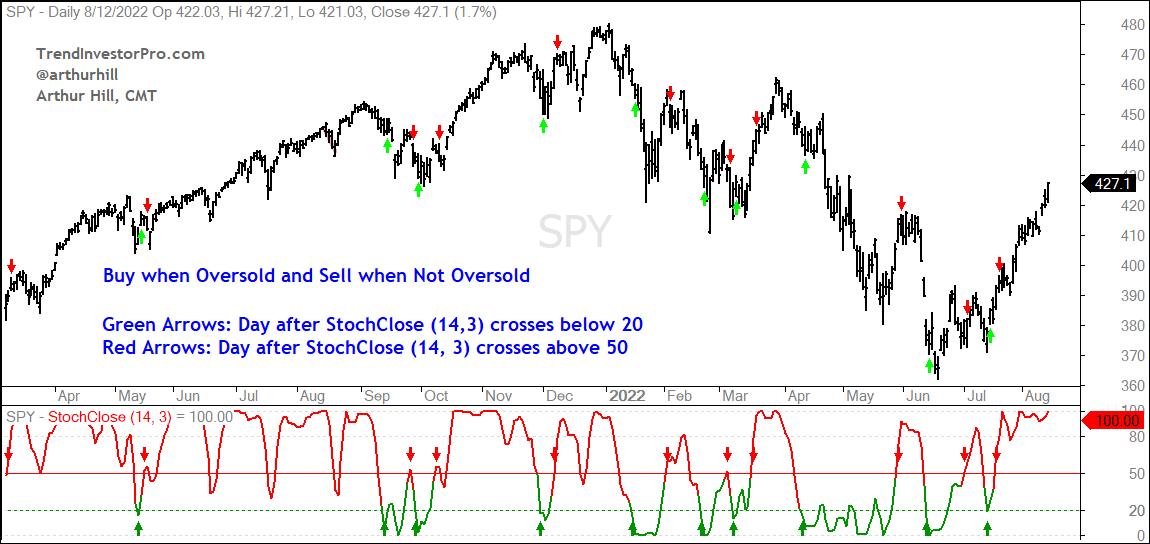
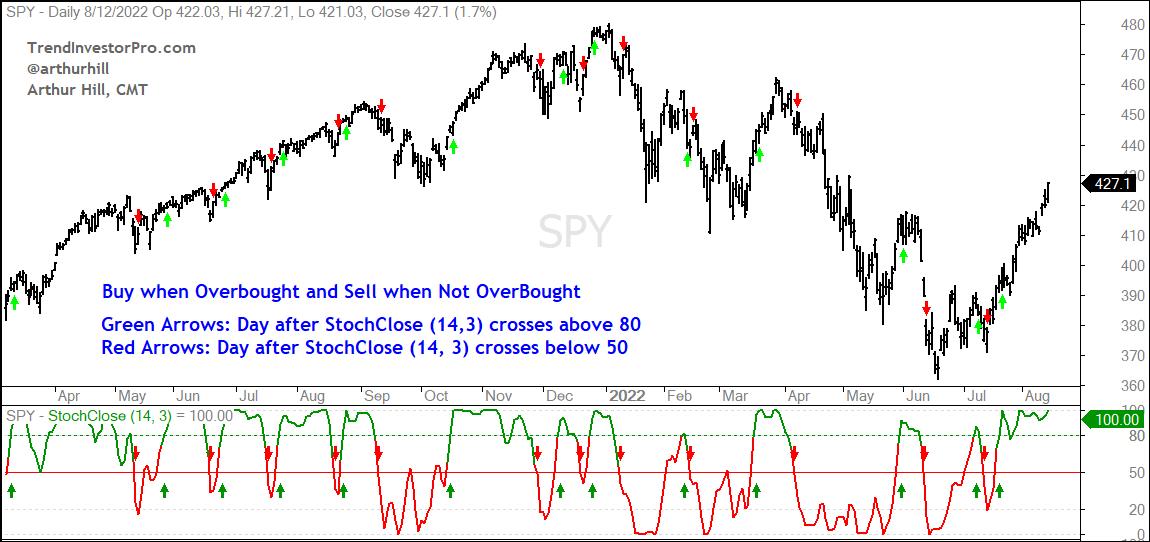
The purpose of this exercise is not to create a stand alone system. Instead, it is to under understand the nature of overbought and oversold over the last 20+ years. There are two key takeaways. First, overbought conditions last longer than oversold conditions. On average, the overbought trades lasted 17 days and the oversold trades lasted just 11 days. The current overbought trade is 17 days so far. Second, oversold trades have a much higher chance of turning a profit than overbought trades. Buying when StochClose crosses below 20 and selling when StochClose crosses above 50 was profitable 72% of the time with an average gain of 2.2%. Buying when StochClose crossed above 80 and selling when it crossed below 50 was profitable 44% of the time, but the average gain was higher (2.93%).
There were some new Trend Composite signals this week in our ETF universe and we highlighted these signals along with the ATR Trailing Stop for trend-following. We are also monitoring the advance in SPY using short-term breadth for clues on underlying strength. This analysis is included in our detailed reports and comprehensive videos. Click here for immediate access.
The StochClose, the Trend Composite, ATR Trailing Stop and eight other indicators are part of the TIP Indicator Edge Plugin for StockCharts ACP. Click here to take your analysis process to the next level.
---------------------------------------
Choose a Strategy, Develop a Plan and Follow a Process
Arthur Hill, CMT
Chief Technical Strategist, TrendInvestorPro.com
Author, Define the Trend and Trade the Trend
Want to stay up to date with Arthur's latest market insights?
– Follow @ArthurHill on Twitter


