 The broad market environment remains bearish, but one group stood out in early August and continues to stand out. The Solar Energy ETF (TAN) was featured on August 1st as the Trend Composite turned bullish and clean energy was featured as an emerging theme on August 5th. Clean energy ETFs are bucking the bear market and we will look at the Alps Clean Energy ETF (ACES) today.
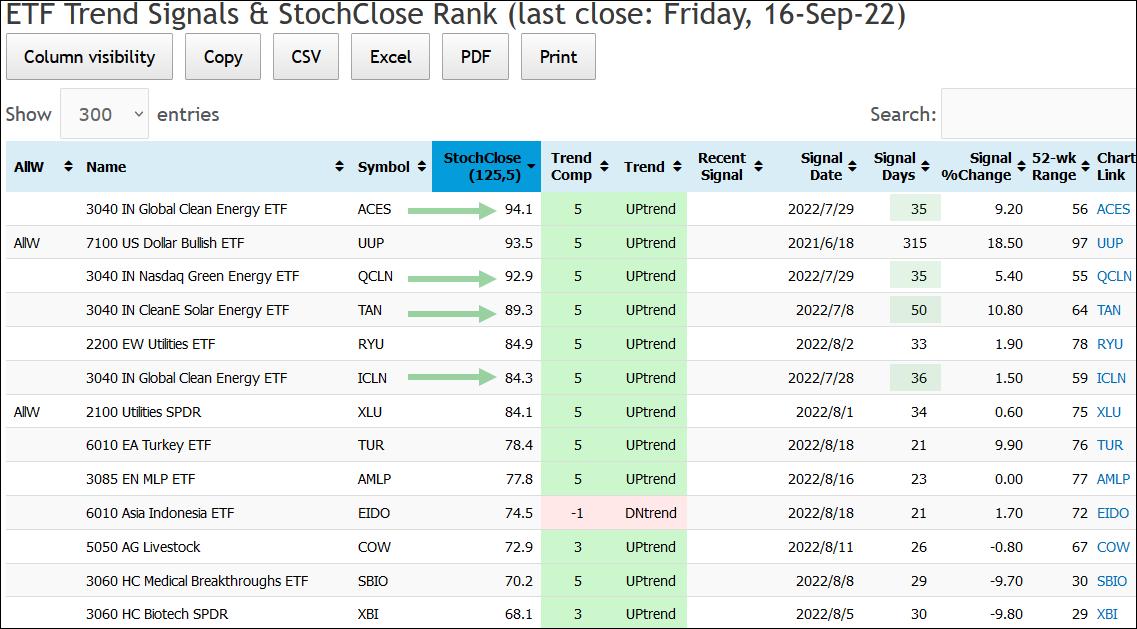
First, let's check the trend signal and ranking table, which covers 274 ETFs and is available to subscribers at TrendInvestorPro. ACES sits at the top with a StochClose value of 94.1, which means it is close to a six month high because StochClose has a 125-day lookback. There are three other clean-energy ETFs in the top six (QCLN, TAN and ICLN). The Trend Composite triggered bullish 35 days ago for ACES and QCLN, 36 days ago for ICLN and 50 days ago for TAN (green shading on signal days column).
The next chart shows ACES with the Trend Composite turning positive in late July. This indicator aggregates trend signals in five trend-following indicators and is part of the TIP Indicator Edge Plugin for StockCharts ACP. There was also a breakout on the price chart as the ETF gapped above the June high. ACES then formed a small falling wedge into September and this is viewed as a bullish continuation pattern. It is a short correction after the July-August surge and the wedge breakout is bullish.
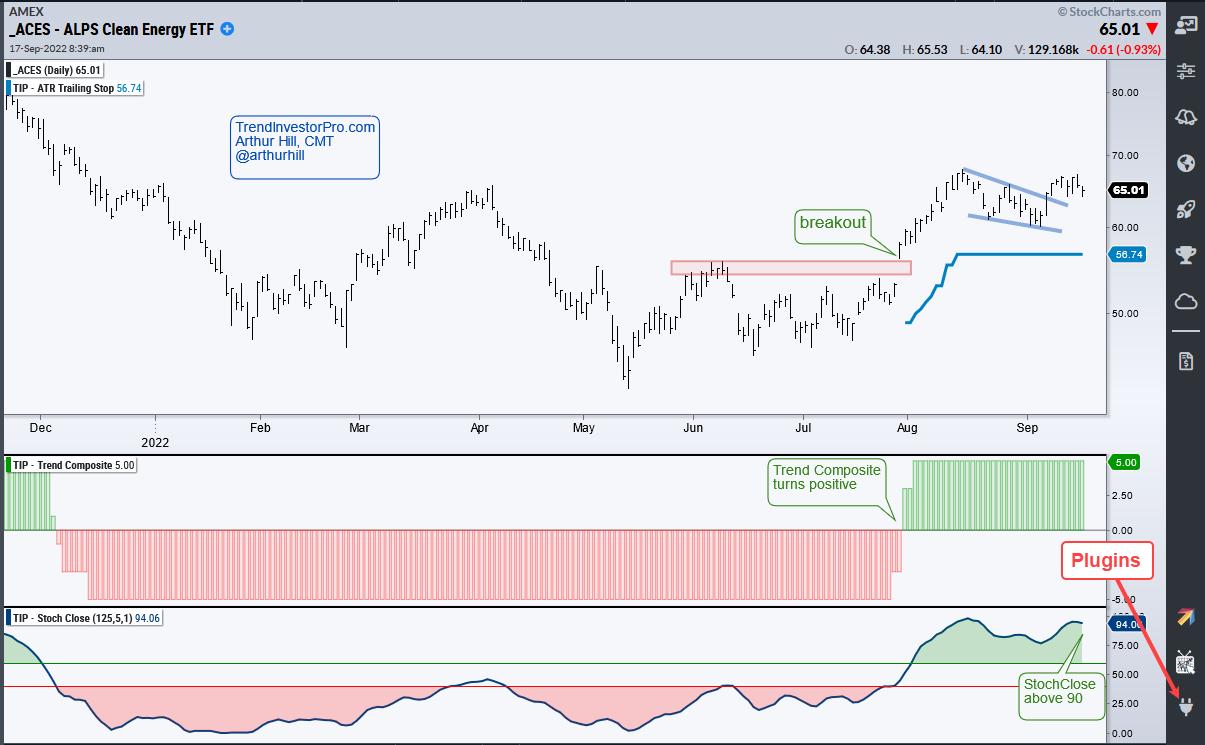
The blue line on the chart is the ATR Trailing Stop, which is set 6 ATR(22) values below the highest close since the Trend Composite turned positive. As a trailing stop, it rises when prices rise and flatlines when prices fall. I view ACES as firmly bullish as long as this stop holds and the Trend Composite remains positive.
StochClose, the Trend Composite, ATR Trailing Stop and eight other indicators are part of the TIP Indicator Edge Plugin for StockCharts ACP. Click here to learn more and take your analysis process to the next level.
TrendInvestoPro remains very selective when it comes to stock-based ETFs because the Composite Breadth Model has been bearish since April 11th and the vast majority of ETFs are in downtrends. Subscribers get access to the breadth model, ETF signal/ranking table, twice-weekly reports, comprehensive video and premium strategies. Click here for immediate access.
---------------------------------------
Choose a Strategy, Develop a Plan and Follow a Process
Arthur Hill, CMT
Chief Technical Strategist, TrendInvestorPro.com
Author, Define the Trend and Trade the Trend
Want to stay up to date with Arthur's latest market insights?
– Follow @ArthurHill on Twitter


